Introducing Wallaby.js App: realtime bird's eye view of your project's tests connected to your editor
When I think about tactics vs. strategy, one of my favourite video games always comes to mind - Heroes of Might and Magic (of course version III). It may sound like a strange opening line for a software development tool announcement, but bear with me.
It is recognised by many JavaScript developers that wallaby.js, as a plugin for your code editor, is the great tactical level tool. It increases your productivity by instantly providing the test results right where you need them just as you type your code. And like in a middle of the Heroes game battle you don’t care about you resources and castles and concentrate on your troops actions, when writing your code for a specific feature you don’t care much about how many tests you have and what’s the overall code coverage level.
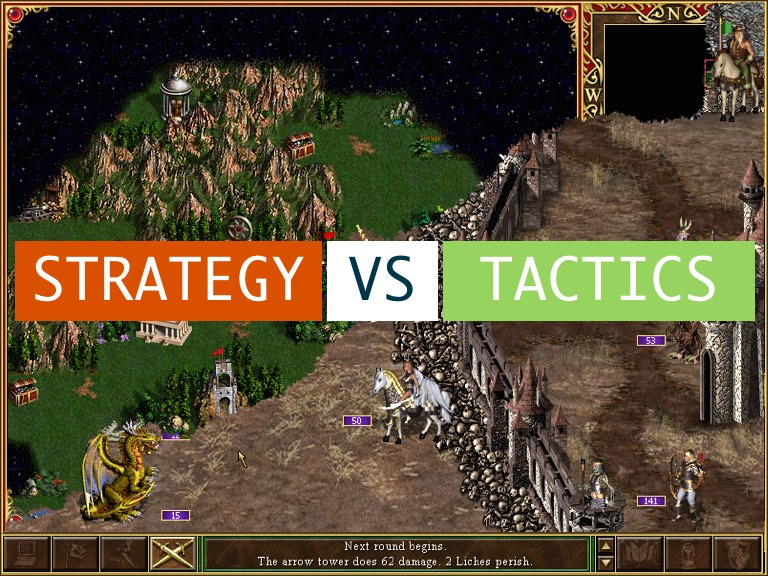
However, when the battle is over and the feature’s tests are passing (and you maybe even levelled up), it’s often good to take a step back and get a bird’s eye view of the project. Since the very first release of wallaby.js, we have been getting requests to provide more strategic level features, such as Castle View and World Map Test Explorer or Code Coverage Reports.
To implement the requests and create a foundation for future strategic level features, some time ago we have started to work on something we call wallaby.js app and today I am happy to announce the release of wallaby.js app beta.
Now, instead of providing a long installation guide, what if I told you that you can just open a URL in your browser to start using the app right now? It’s as simple as that: wallabyjs.com/app.
Note that you need to have wallaby.js configured and running in your editor (core v1.0.257 or later) to use the most of the app.
For those of you who feel uncomfortable seeing the external URL, it’s worth mentioning that we just use it to host the app, which makes a connection to the locally running wallaby core. Wallaby.js doesn’t upload any of your project’s source code to the cloud. If you like, you may easily check it in your browser’s Dev Tool Network panel. We’ll also be providing an npm package to install wallaby.js app locally and fully run from the localhost.
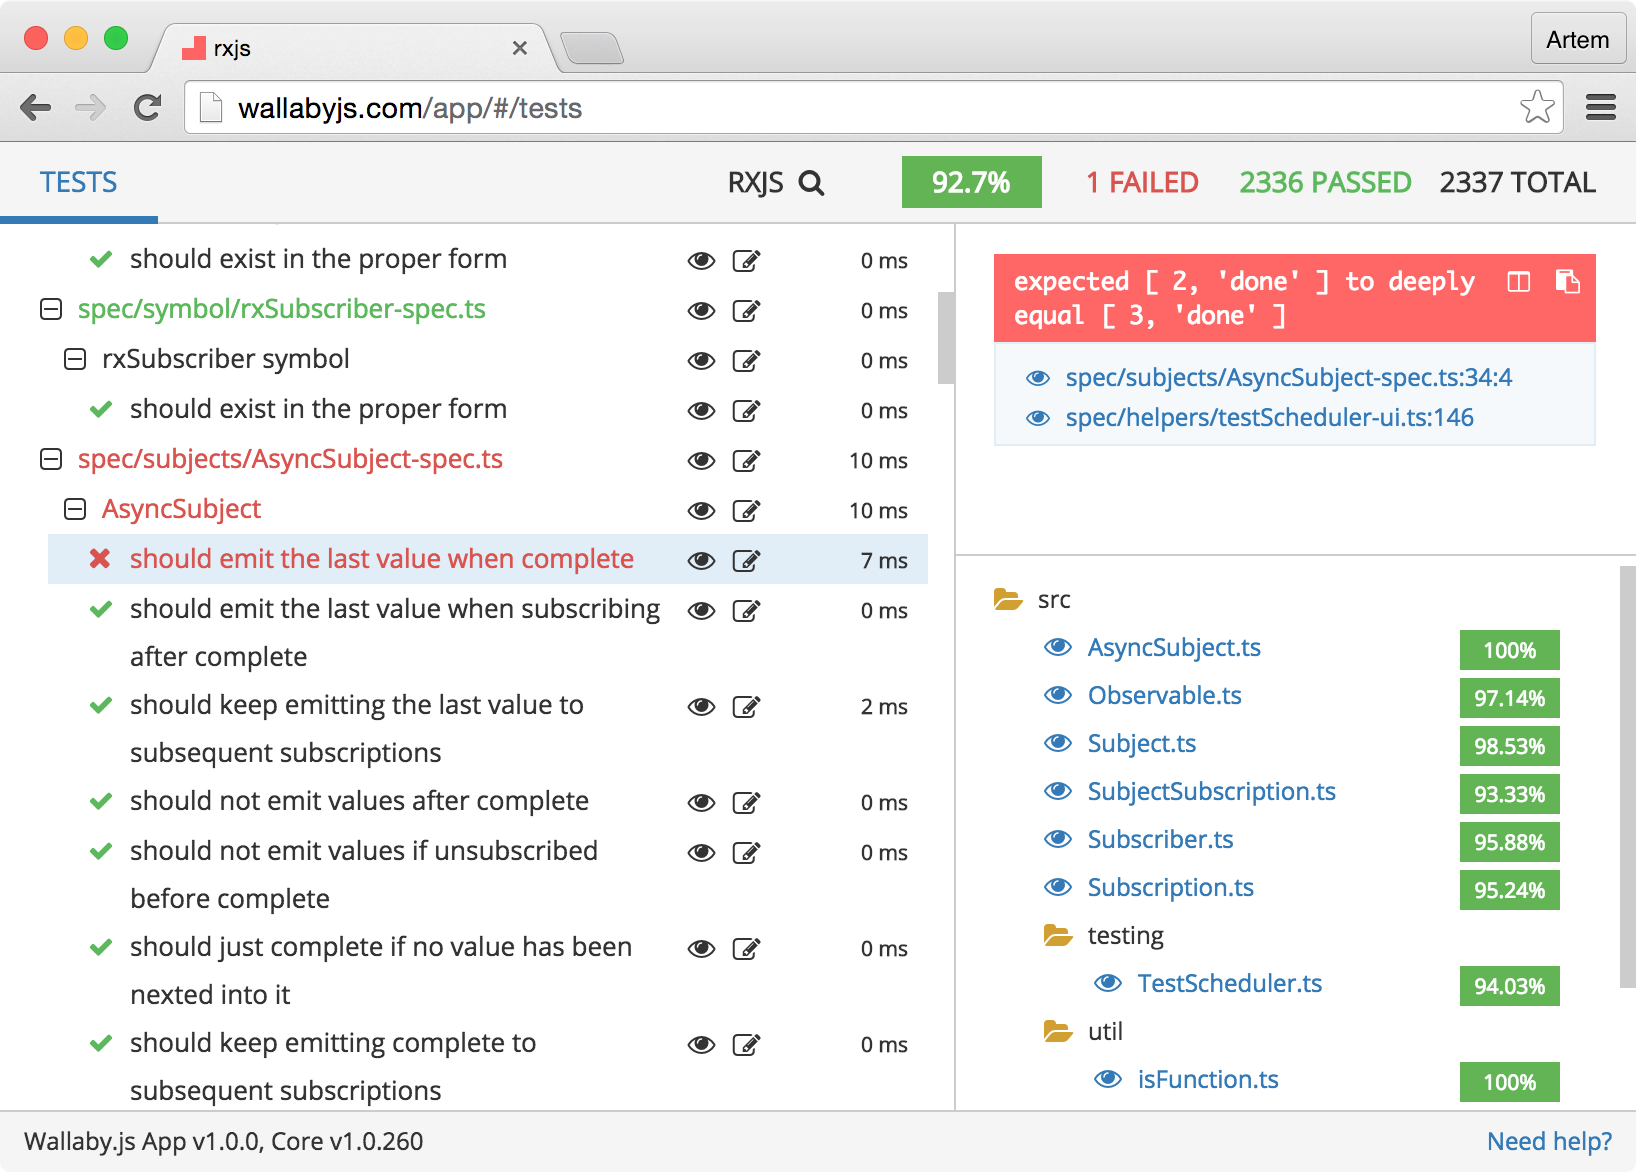
Ok, let’s already check out what the app can do. In the first version we are releasing the Tests View that allows you to quickly get tests-centric overview and analytics for your project.
On the left hand side you can see the tree of your project tests. You may navigate it with the keyboard using arrow keys, plus Cmd/Ctrl (Shift) to expand a node or the whole tree. For each tree node you may see the execution time (aggregated for files and test suites) and an indicator if some of the tests are slow. A test is considered as slow if its execution time is greater than a configurable value. With mocha framework, the value can also be overriden by any describe or it using the this.slow function.

Before describing the rest, I’d like to mention that, despite being a strategic level tool, wallaby.js app is not a static report: almost everything gets updated automatically in realtime when you change your code, add or remove files, increase code coverage, etc.

For any file or test displayed anywhere in the app, you may open its location in your editor by clicking the editor icon (or the stack entry/file link), or pressing Cmd/Ctrl + Enter while in the tests tree.
However, sometimes you may not want to leave the app to view the code, for example because you are not planning to change it right now. In this case you may use the eye icon or press Enter for the selected tree node to open the source right inside the wallaby.js app.

As you can see, the displayed file view provides a similar experience that you have in wallaby.js plugin for your editor - you may see the coverage indicators, uncovered code regions and inline error/log messages.
While being able to view some file or a test under your mouse is great, sometimes you may want to open any file of your project. To do this, you may just use the magnifier icon next to the project name in the app header, or press Shift twice, enter the file name and view it.

While in the tests tree, you may select a test or a file to see its details. The details include errors or console.log messages logged while executing the test. If you select a test file, you’ll see the errors and log messages for all tests in the file.

The details of the selected test or test file also display the tree of the source files that are covered by the test. Each file in the tree contains its current code coverage value. If the value is too low, it is highlighted in yellow.
The overall project code coverage and other project stats are also displayed in the top right corner.
The Tests View by no means is a final version, let us know what you’d like to be added or changed, your feedback is very welcome. In the upcoming weeks, we are planning to add the Coverage View to provide file tree centric view of project code coverage, so stay tuned. You are also welcome to join the discussion and share your ideas about what else you’d like to see in the app.
That’s it for the post, thanks for reading! Follow us on Twitter to avoid missing new wallaby.js app features announcements.