Testing angular.js application with wallaby.js
In case if you haven’t seen wallaby.js yet - it is an intelligent test runner for JavaScript, that runs your tests and displays the feedback as you write your code. Wallaby.js runs your tests very fast - it uses runtime dependency analysis to only execute tests affected by your code changes and parallel test execution.
In this tutorial, I’ll demonstrate to how to set up wallaby.js for a typical angular.js project and use it in WebStorm. The same way you can also use it in PhpStorm, RubyMine, PyCharm or IntelliJ IDEA.
First, open this angular.js todo mvc sample project. You can either clone the repository:
git clone https://github.com/wallabyjs/wallaby-angular-todomvc.git
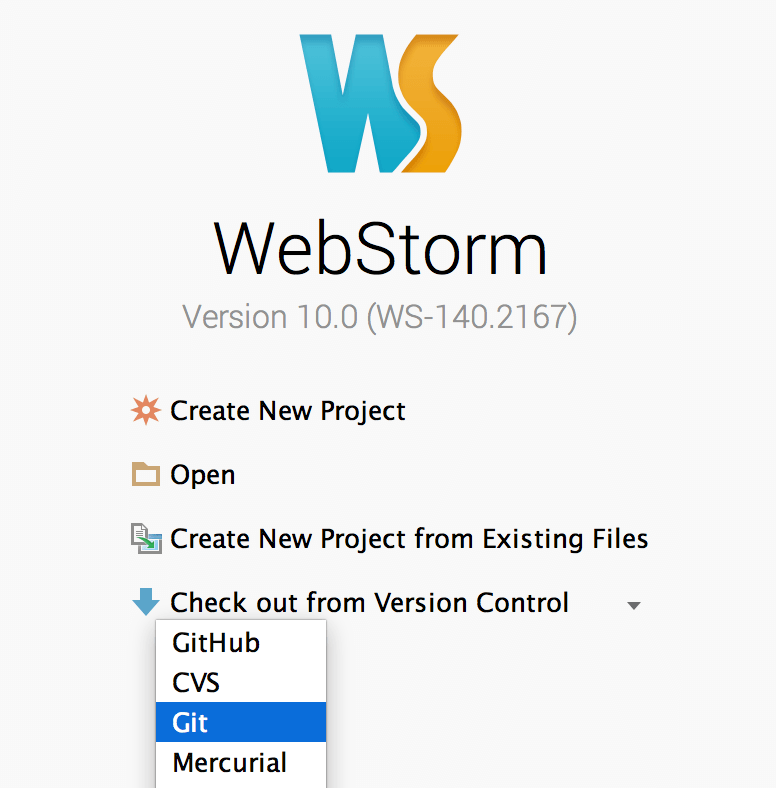
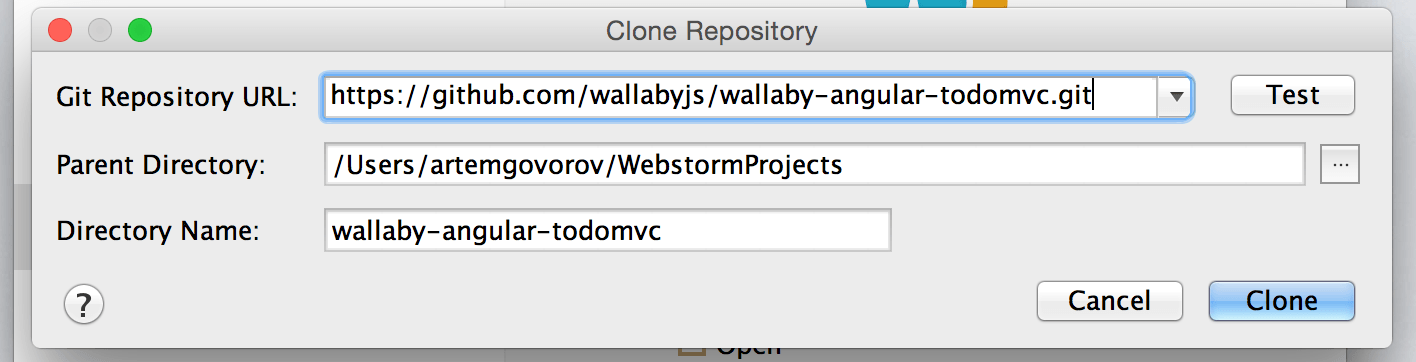
and open the project in WebStorm, or just open WebStorm and clone the repository right from the splash screen.
Second, download and install wallaby.js, if you haven’t already. To do that:
- Download wallaby.js plugin from the website.
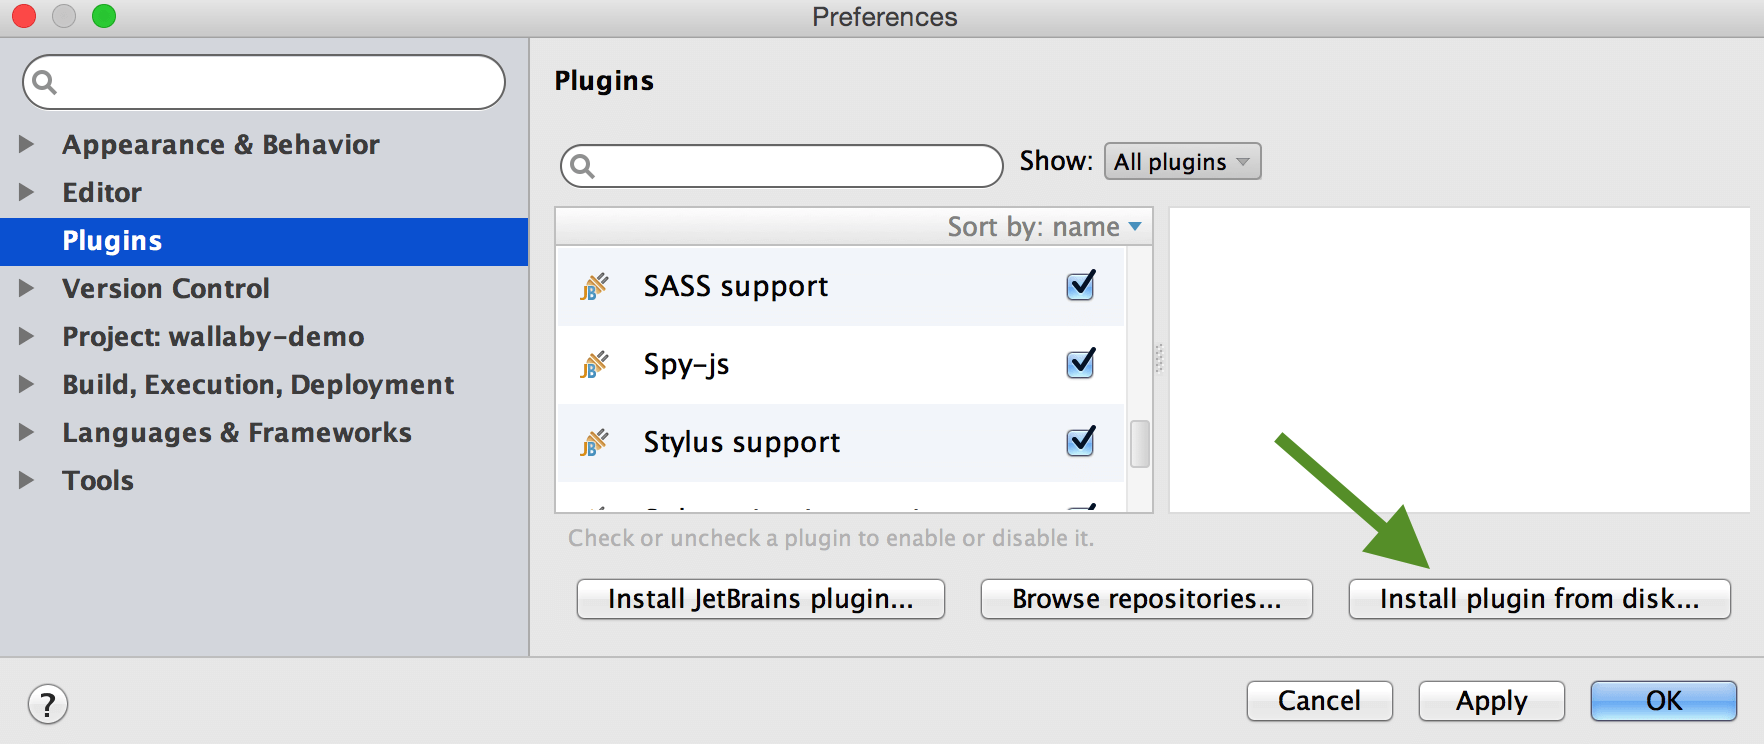
- Install it by opening WebStorm settings dialog and using Install plugin from disk button on Plugins configuration page.
Next, we need to install the project dependencies. To do this, run:
npm install
using your CLI, WebStorm built-in Terminal, or just by right-clicking on the package.json file in the project root folder and selecting Run ‘npm install’ action.
Once all the dependencies have been installed, we need to create wallaby.js configuration file. All we need to do is to let wallaby.js know what source files it should track and where our tests are.
Create wallaby.js file in the project root folder and add the following content to it:
module.exports = function () {
  return {
    "files": [
      {pattern: 'node_modules/angular/angular.js', instrument: false},
      {pattern: 'node_modules/angular-route/angular-route.js', instrument: false},
      {pattern: 'node_modules/angular-mocks/angular-mocks.js', instrument: false},
      'js/**/*.js'
    ],
    "tests": [
      'test/unit/**/*.js'
    ]
  };
};
This means that wallaby.js should use angular.js from the installed node_modules, track all source files located in js folder and run all tests located in the test/unit folder.
Other configuration options and the full format of wallaby.js configuration file is described in wallaby.js documentation.
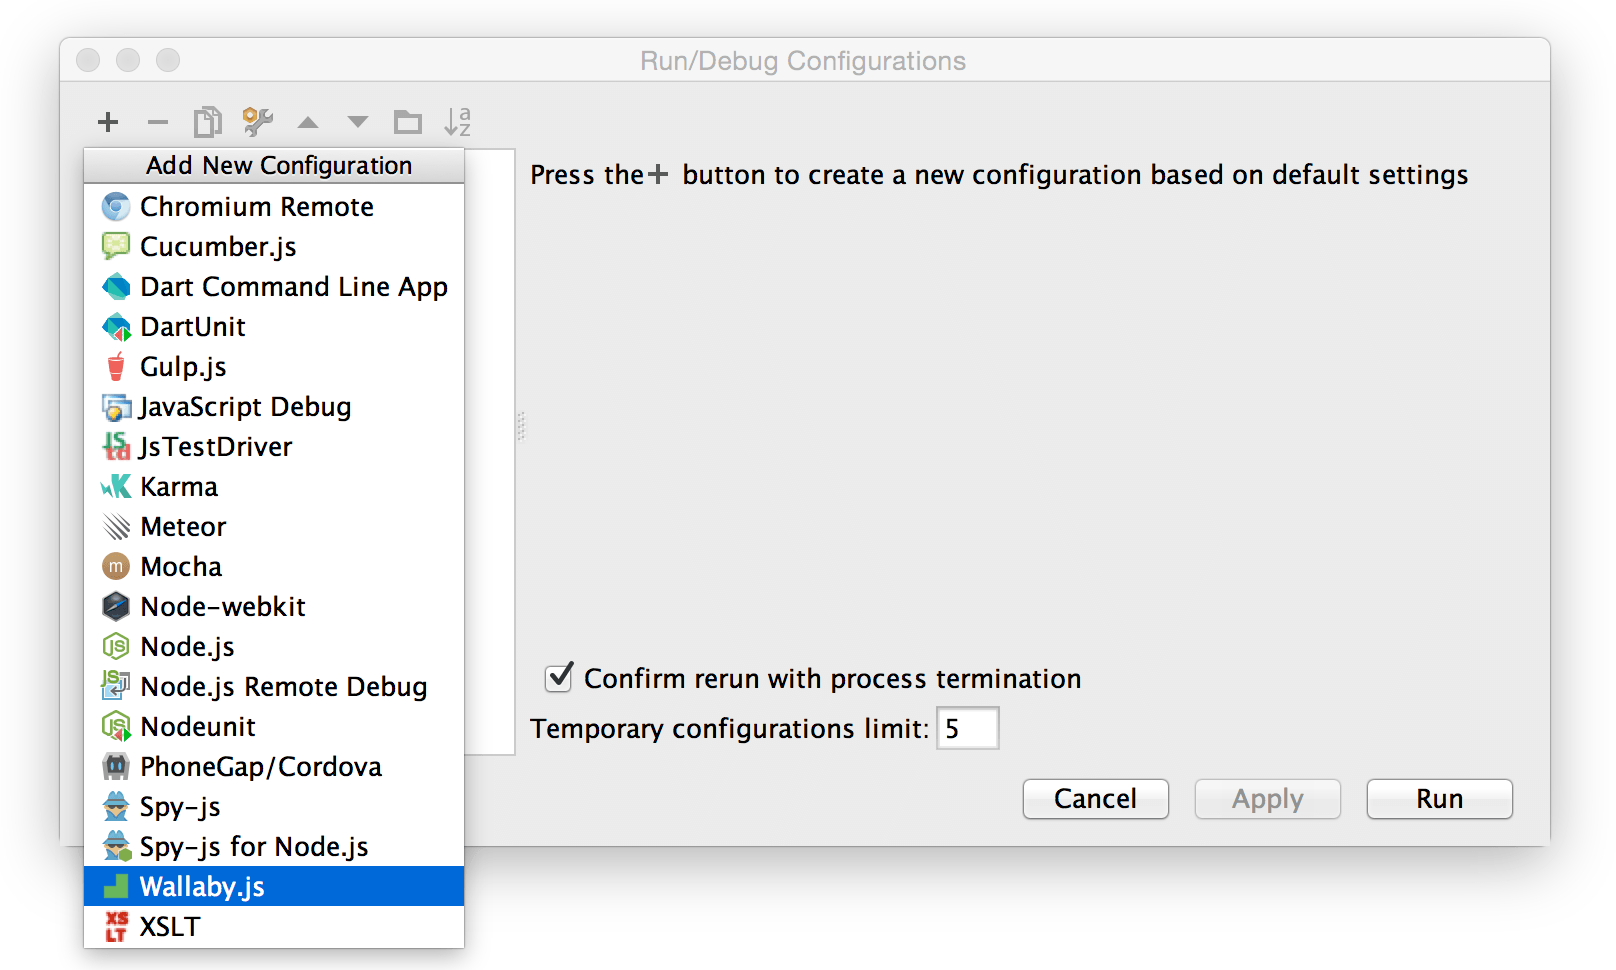
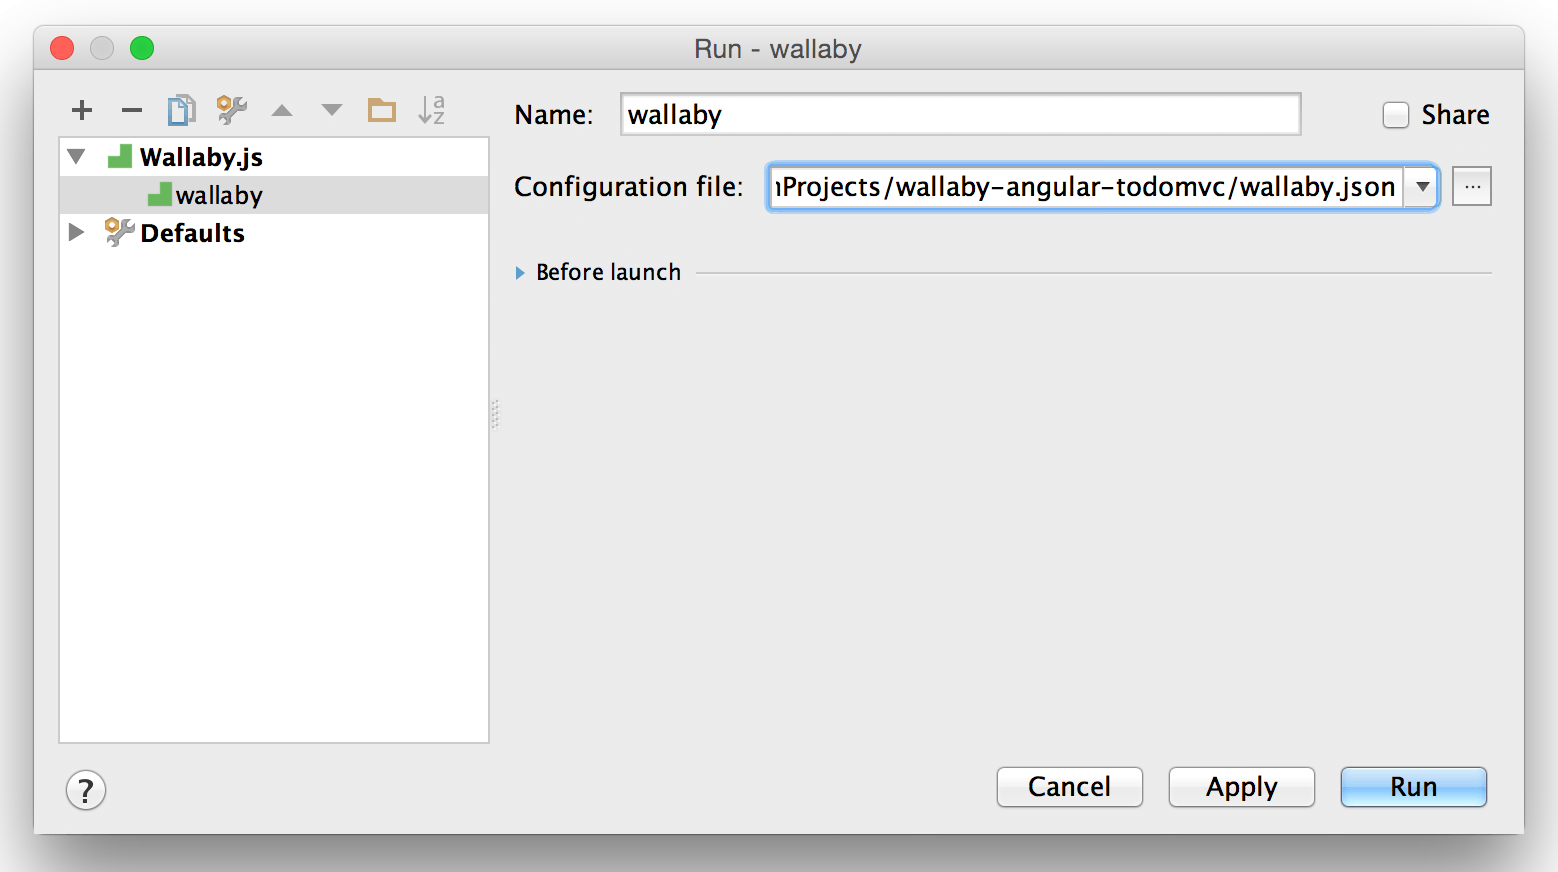
Now we need to create wallaby.js Run Configuration, that we will be using to start and stop wallaby.js. Select Run menu, Edit configurations and create new wallaby.js configuration.
Give the configuration name you like and from the Configuration file drop-down list, select the JSON file we have just created.
We are ready to go now - start the created configuration using Run menu.
When starting for the first time, wallaby.js will download and install some dependencies. Those include node.js, that is used to run wallaby.js, and PhantomJs headless browser engine to run your tests in. The installation may take a minute or so and only happens once.
After the start, wallaby.js displays its tool window at the bottom:
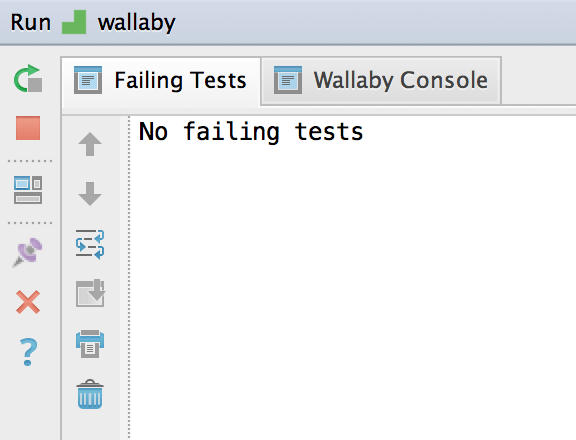
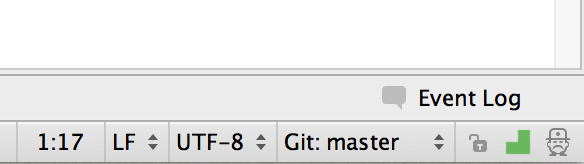
and its status indicator at the right bottom corner of the window.
The indicator displays a spinner when your tests are running, red icon if any of the tests is failing and green icon if all tests are passing. The tool window Failing tests tab displays the information about failing tests, such as error stacks and failed expectation details.
Once started, you don’t need to restart wallaby.js run configuration to run your tests, as it does it automatically, as you change your code. You can even hide the tool window by using the Hide icon in its right top corner, as you will be getting the information about failing tests right in the context of the code that you’re editing. You can always get the tool window back by clicking wallaby.js status indicator.
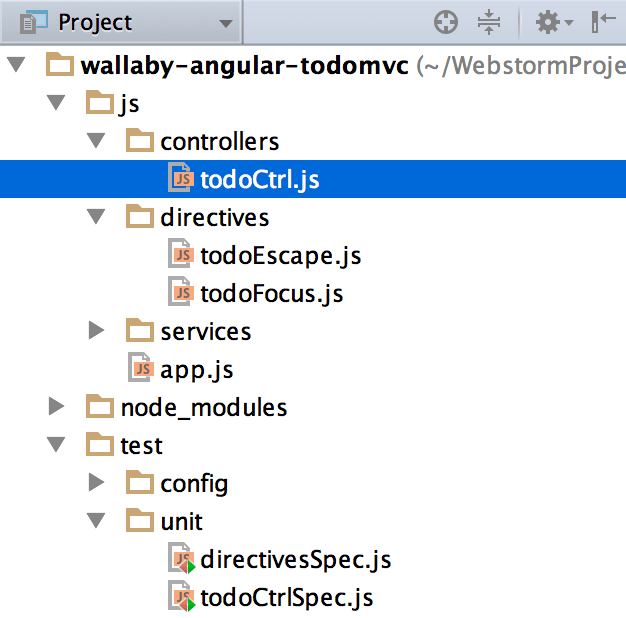
So, let’s see wallaby.js in action. Open one of the application source files, for example angular.js controller todoCtrl.js.
When wallaby.js is up and running, you should be able to see coverage indicators in the gutter of the code editor.
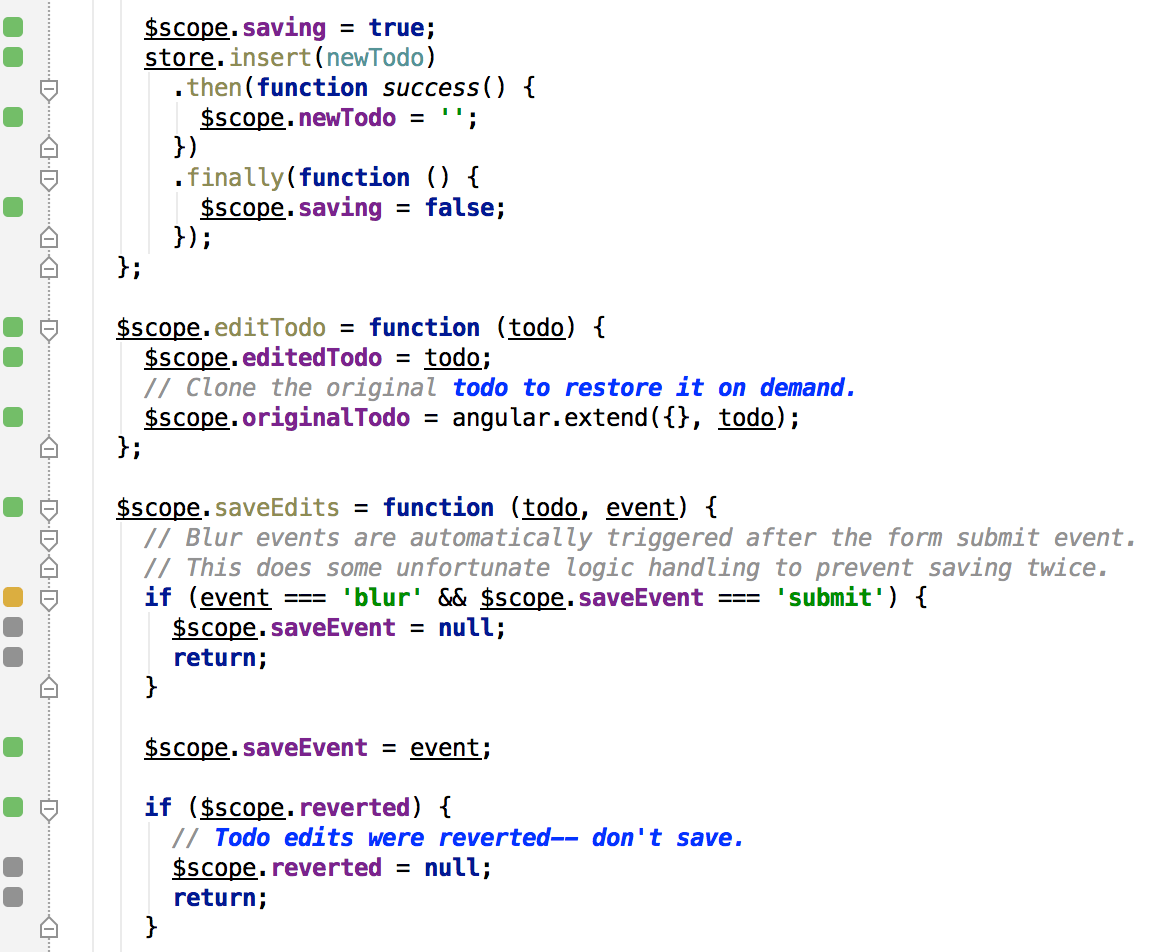
- Gray square means that the source line is not covered by any of your tests.
- Green square means that the source line is covered by at least one of your tests.
- Yellow square means that the source line is only partially covered by some of your tests.
- Red square means that the source line is the source of an error or failed expectation, or is in the stack of an error.
- Pink square means that the source line is on the execution path of a failing test.
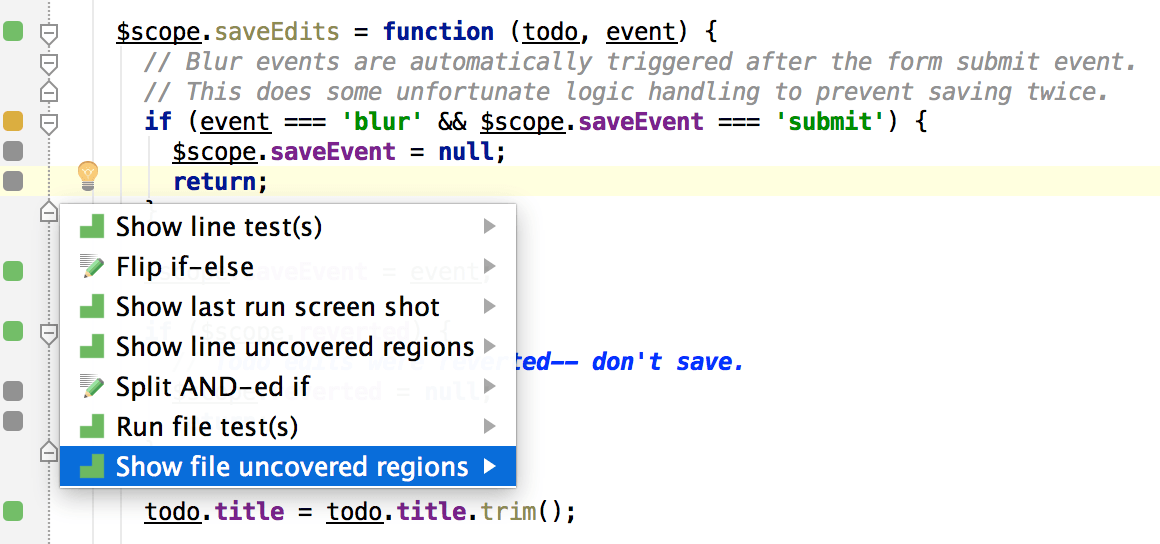
On any line of the source code you can hit Alt + Enter (or use the light bulb icon) and display wallaby.js context actions. You can read more about all actions in the documentation. For this example, let’s see all uncovered regions of the source file that we have opened.
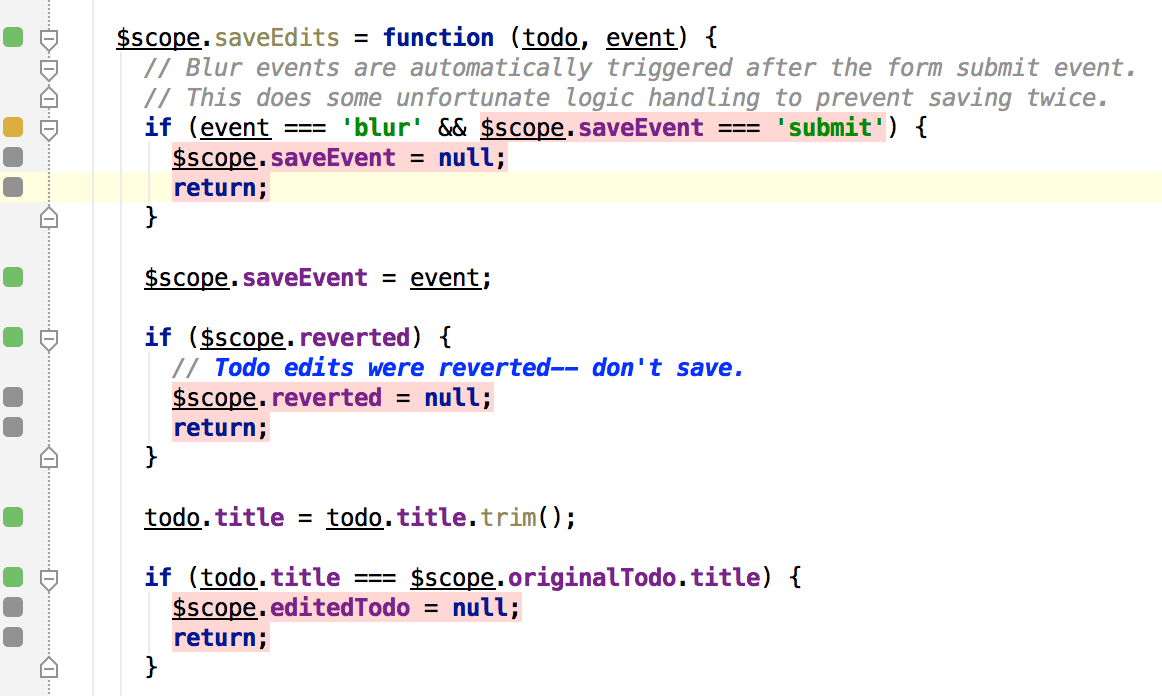
We can now clearly see what is exactly not covered inside the line with the yellow coverage indicator, because wallaby.js tracks coverage for logical expressions and conditional operators as well.
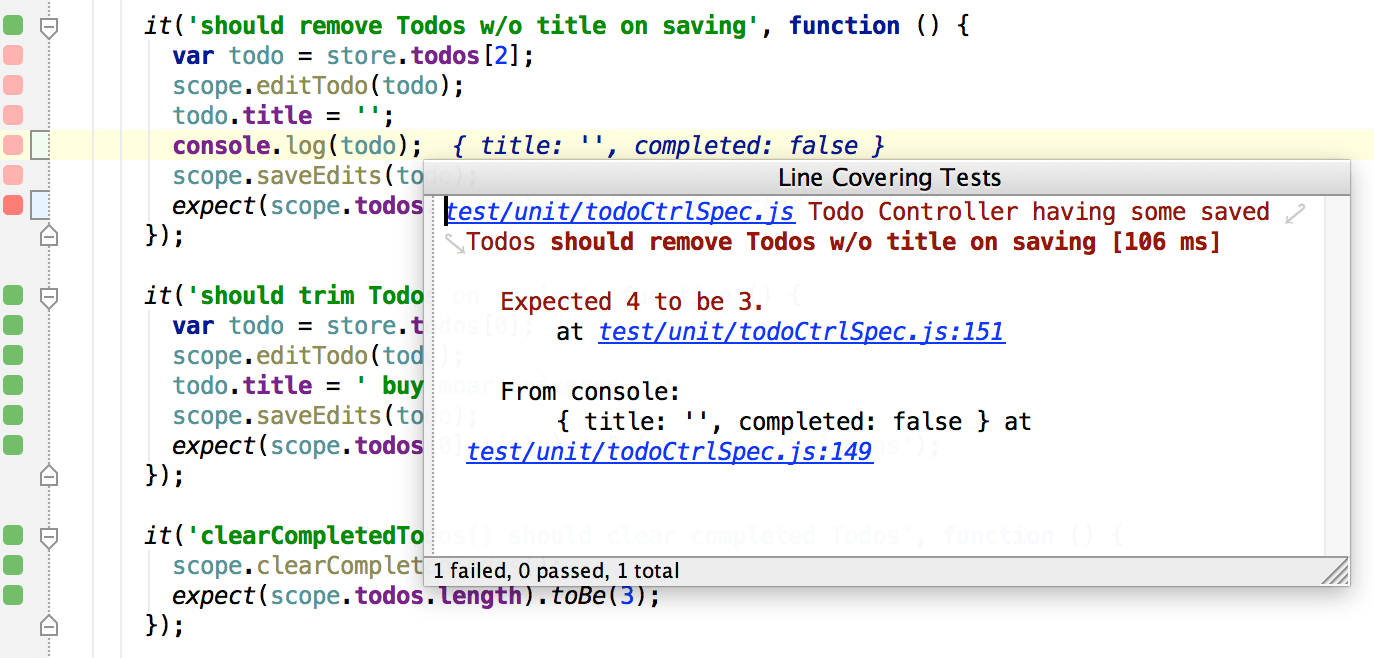
Now, let’s see what tests are covering the source file. To do that, on any line hit Alt + Enter and select the Show line test(s) action.
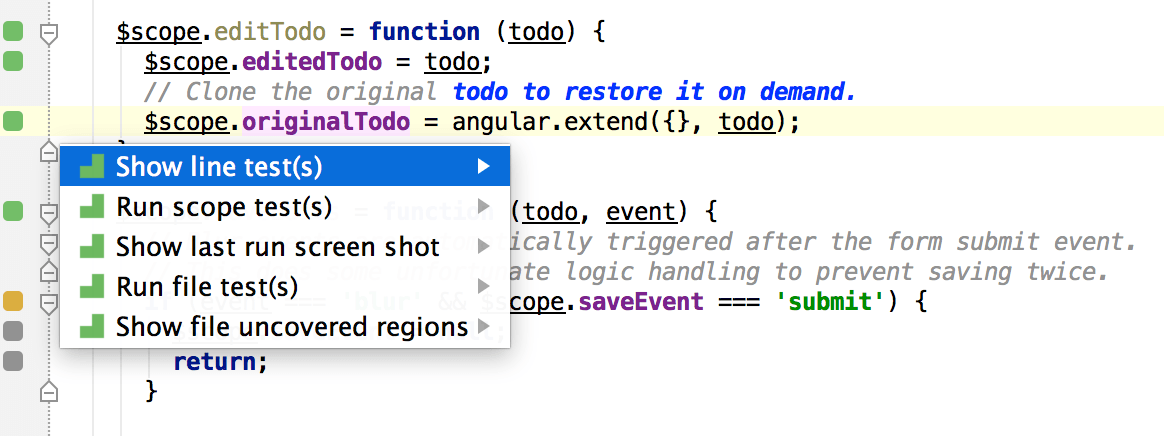
Tests window is displayed and all the tests that are covering this line of code are displayed inside. If any of the tests is failing, then full error stacks and expectation errors are displayed as well.
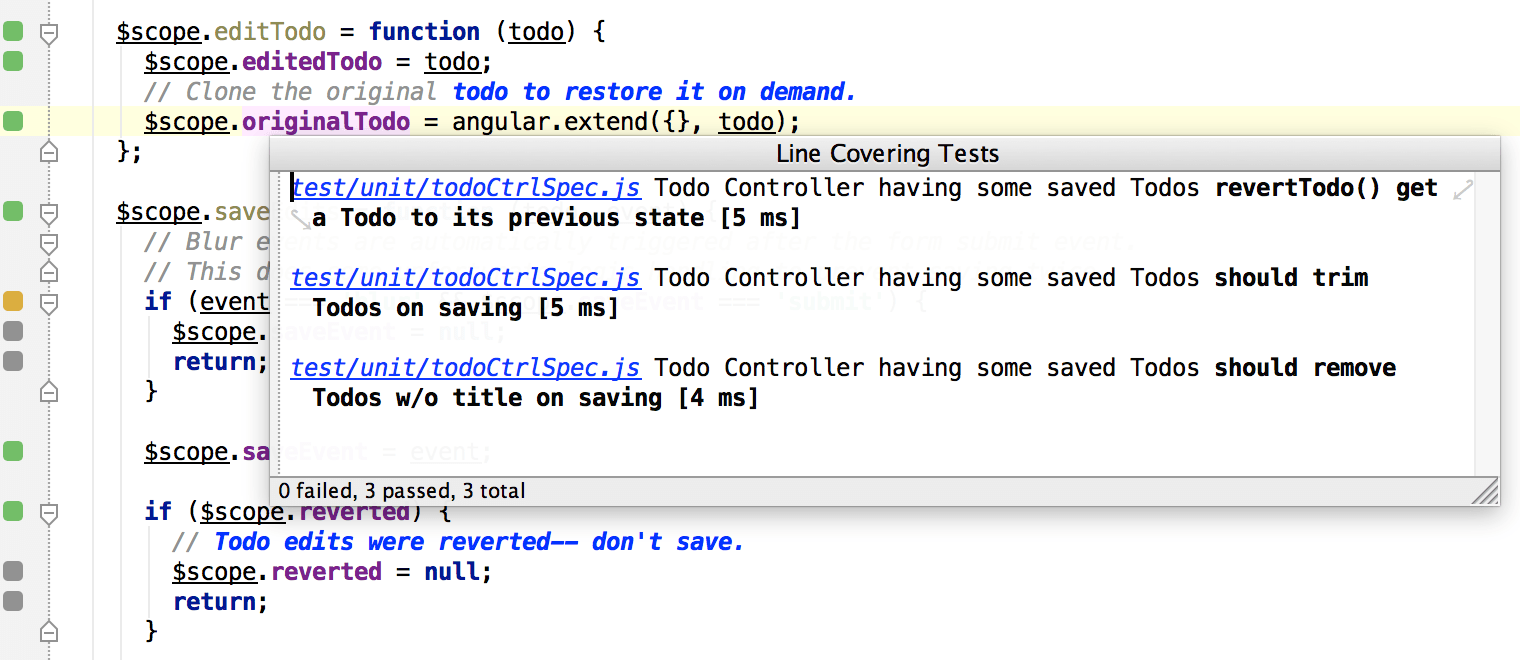
The window is searchable with Ctrl/Cmd + F and all the links inside it can be clicked using your mouse or used from the keyboard with Ctrl/Cmd + B shortcut. You can hide the window by hitting Esc.
While inside the window, let’s navigate to one of the covering tests by using the link next to the test full name.
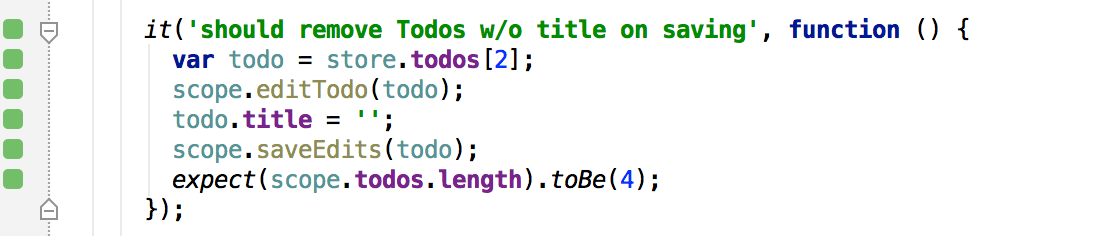
The test is checking that if we change some todo item title to be an empty string, then, when saving items, the item with empty title should be removed. Now let’s change the expectation code to see how wallaby.js reacts.
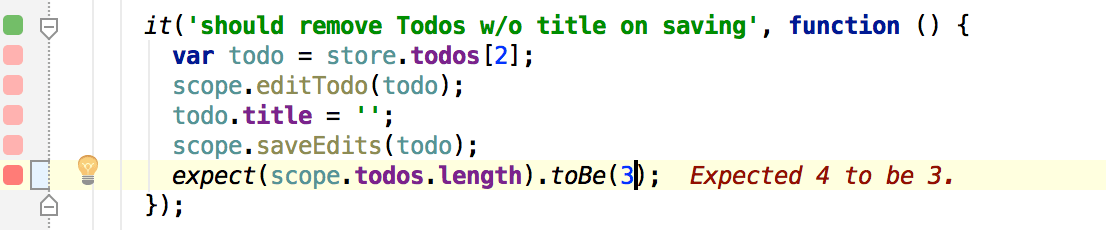
Immediately as we do so, wallaby.js displays the expectation error right where it occurs. The test path line indicators become pink, the source of the error line indicator is now red.
Apart from displaying errors where and when they occur, wallaby.js also displays console.log output in a similar manner, so if you’re a fan of console.log, you are going to love what you see next:
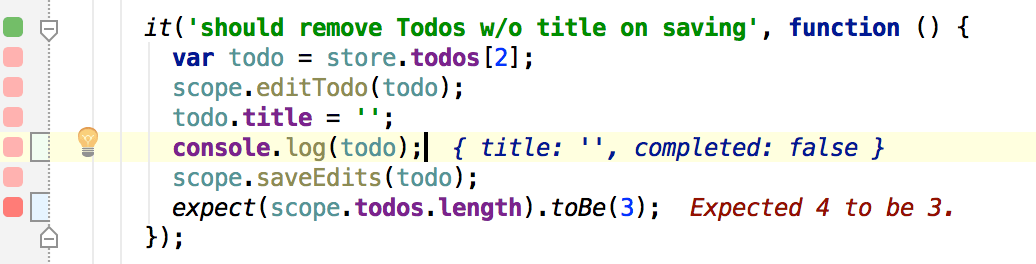
We pass todo object to the console.log and we can immediately see the result. You can output anything and anywhere this way, to quickly inspect the objects that you’re interested in.
Some objects or errors may contain large amount of data, that is not viewable inline. To inspect the full message, you can always use Alt + Enter and invoke Show line test(s) action to see the full output in the context of some source code or a test that you are interested in.
Finally, let’s get back to the controller source file todoCtrl.js, find some uncovered function and write a test for it.
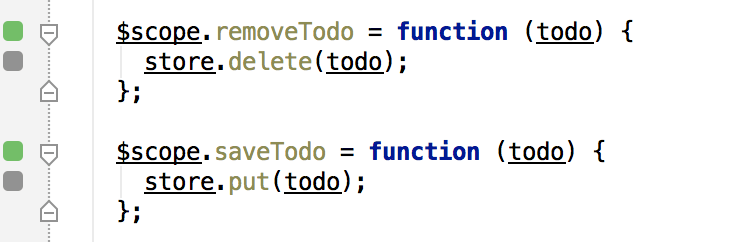
For example, let’s cover removeTodo function with a test. To do that, I will add a new test to one of the existing test files. In the test, I will get one of the pre-created todo items, pass it to the removeTodo function and ensure that the total number of the items has decreased by one.
That’s it for the blog post, thanks for reading and hope it helps you to get started with wallaby.js in your project. Follow us on twitter to stay updated.