Many of you have used several different code coverage solutions and reports. In this blog post we will explore some of the essential features of a code coverage report solution and introduce the way we have implemented them in wallaby.js app.
File tree
First, a good JavaScript code coverage report should display an annotated project source code tree. Folders is a natural way to organise your project code into modules or subsystems, and sometimes one may only be interested in focusing on a specific part of the project when working with code coverage metrics.
Not many code coverage solutions bother to provide the tree, and it is sad, because the project file tree with node annotations is a great way to explore the code coverage for individual modules.
Here’s an example from JetBrains IDEs:
Sortable table
Second, a good JavaScript code coverage report should provide an option to sort source files by coverage value, also by a number of total/covered branches/lines/functions, whatever criteria of the code coverage is used. It helps to quickly identify what files need more coverage.
For example, let’s take a look at the Istanbul code coverage report:
We are able to sort all folders, including any nested ones, by coverage, and also open an individual folder and sort its files.
JetBrains IDEs provide a separate view, where you can sort by coverage in any selected folder, but for any nested subfolders you’ll only get an aggregated coverage and have to open it separately to see its files. It’s just like a file tree, but sortable on each individual level.
The issue here in both mentioned ways to present the data is that you can only sort files located in an opened folder, and for the files in its subfolders you can only see/sort by the aggregated values. So it’s not possible to easily display a few least covered files in a whole project or a specific module folder with a few subfolders.
The Wallaby Way
In the new wallaby.js app coverage report we have decided to address the above mentioned issues and to efficiently combine both annotated project file tree and a selected folder/module sortable list of files.
The idea is very simple - you select a folder, and you get the full sortable table of all files in the folder and its subfolders (with a relative path where required).
This way you can both browse the tree structure, see the aggregated coverage values, select a folder/module, and easily find the least covered files no matter how deep your folder structure is.
When I think about tactics vs. strategy, one of my favourite video games always comes to mind - Heroes of Might and Magic (of course version III). It may sound like a strange opening line for a software development tool announcement, but bear with me.
It is recognised by many JavaScript developers that wallaby.js, as a plugin for your code editor, is the great tactical level tool. It increases your productivity by instantly providing the test results right where you need them just as you type your code. And like in a middle of the Heroes game battle you don’t care about you resources and castles and concentrate on your troops actions, when writing your code for a specific feature you don’t care much about how many tests you have and what’s the overall code coverage level.
However, when the battle is over and the feature’s tests are passing (and you maybe even levelled up), it’s often good to take a step back and get a bird’s eye view of the project. Since the very first release of wallaby.js, we have been getting requests to provide more strategic level features, such as Castle View and World Map Test Explorer or Code Coverage Reports.
To implement the requests and create a foundation for future strategic level features, some time ago we have started to work on something we call wallaby.js app and today I am happy to announce the release of wallaby.js app beta.
Now, instead of providing a long installation guide, what if I told you that you can just open a URL in your browser to start using the app right now? It’s as simple as that: wallabyjs.com/app.
For those of you who feel uncomfortable seeing the external URL, it’s worth mentioning that we just use it to host the app, which makes a connection to the locally running wallaby core. Wallaby.js doesn’t upload any of your project’s source code to the cloud. If you like, you may easily check it in your browser’s Dev Tool Network panel. We’ll also be providing an npm package to install wallaby.js app locally and fully run from the localhost.
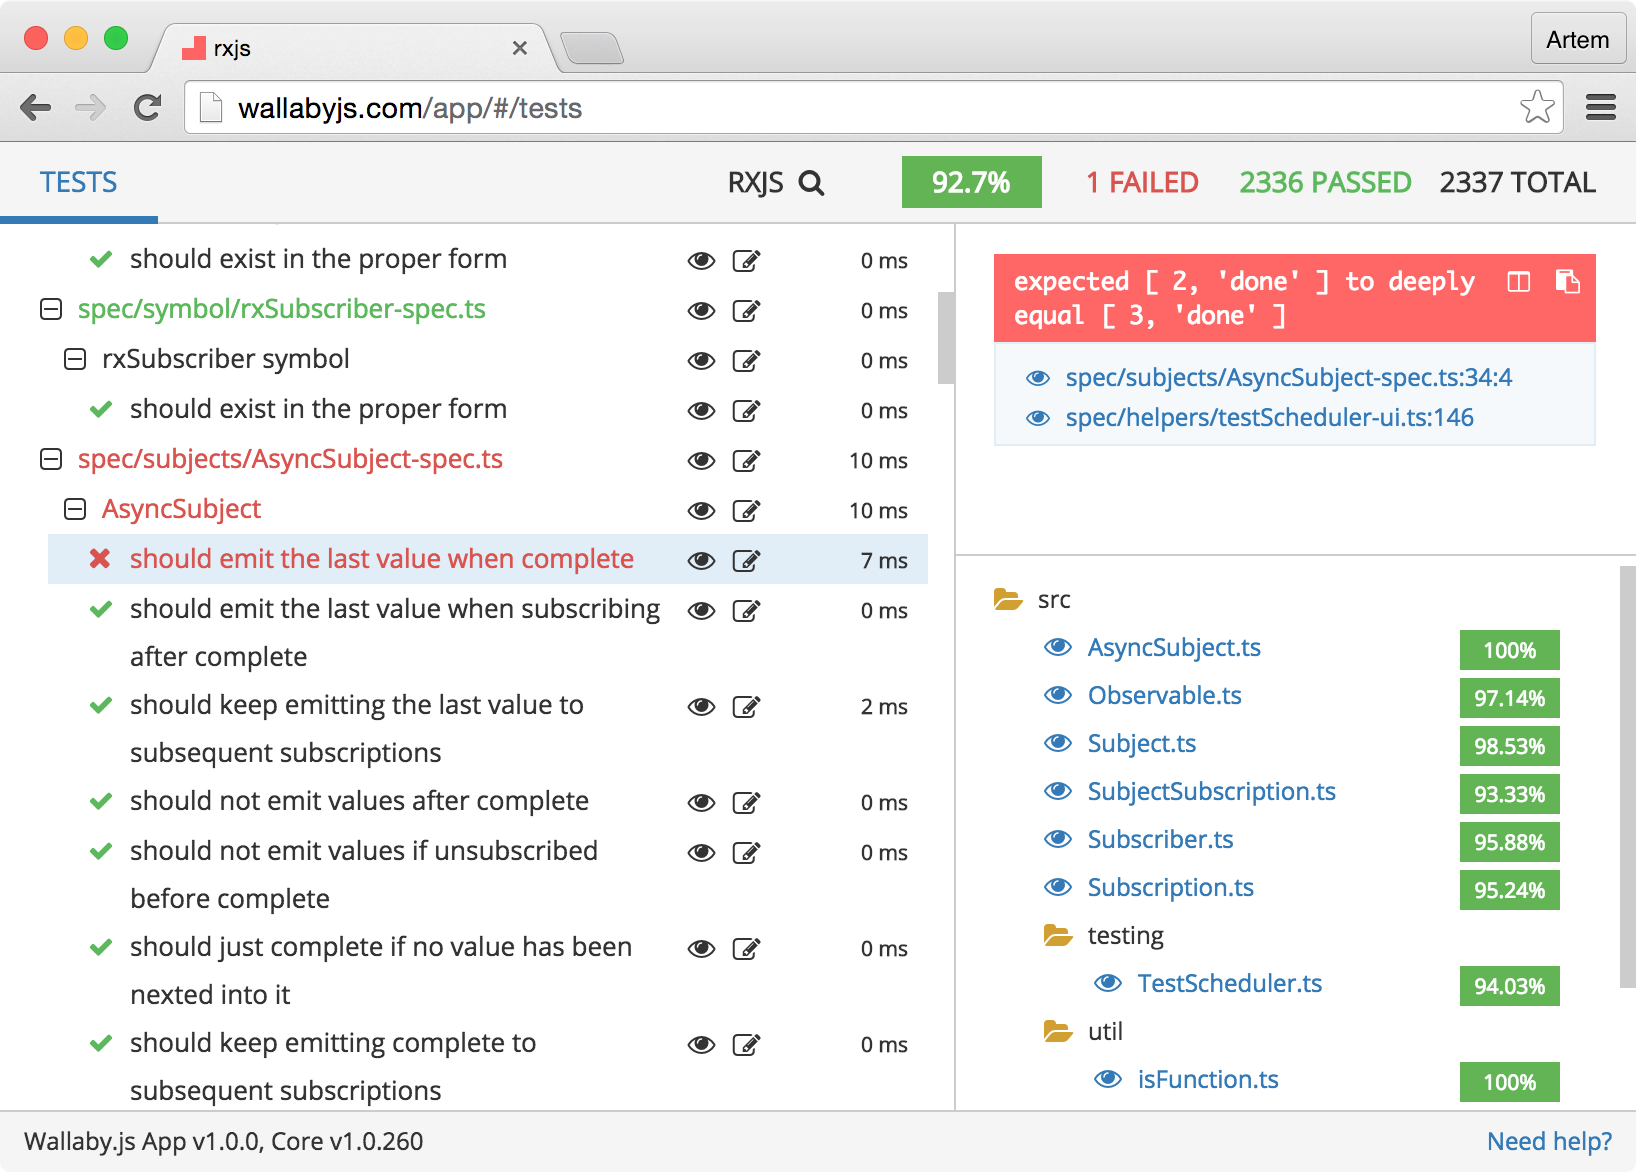
Ok, let’s already check out what the app can do. In the first version we are releasing the Tests View that allows you to quickly get tests-centric overview and analytics for your project.
On the left hand side you can see the tree of your project tests. You may navigate it with the keyboard using arrow keys, plus Cmd/Ctrl (Shift) to expand a node or the whole tree. For each tree node you may see the execution time (aggregated for files and test suites) and an indicator if some of the tests are slow. A test is considered as slow if its execution time is greater than a configurable value. With mocha framework, the value can also be overriden by any describe or it using the this.slow function.
Before describing the rest, I’d like to mention that, despite being a strategic level tool, wallaby.js app is not a static report: almost everything gets updated automatically in realtime when you change your code, add or remove files, increase code coverage, etc.
For any file or test displayed anywhere in the app, you may open its location in your editor by clicking the editor icon (or the stack entry/file link), or pressing Cmd/Ctrl + Enter while in the tests tree.
However, sometimes you may not want to leave the app to view the code, for example because you are not planning to change it right now. In this case you may use the eye icon or press Enter for the selected tree node to open the source right inside the wallaby.js app.
As you can see, the displayed file view provides a similar experience that you have in wallaby.js plugin for your editor - you may see the coverage indicators, uncovered code regions and inline error/log messages.
While being able to view some file or a test under your mouse is great, sometimes you may want to open any file of your project. To do this, you may just use the magnifier icon next to the project name in the app header, or press Shift twice, enter the file name and view it.
While in the tests tree, you may select a test or a file to see its details. The details include errors or console.log messages logged while executing the test. If you select a test file, you’ll see the errors and log messages for all tests in the file.
The details of the selected test or test file also display the tree of the source files that are covered by the test. Each file in the tree contains its current code coverage value. If the value is too low, it is highlighted in yellow.
The overall project code coverage and other project stats are also displayed in the top right corner.
The Tests View by no means is a final version, let us know what you’d like to be added or changed, your feedback is very welcome. In the upcoming weeks, we are planning to add the Coverage View to provide file tree centric view of project code coverage, so stay tuned. You are also welcome to join the discussion and share your ideas about what else you’d like to see in the app.
That’s it for the post, thanks for reading! Follow us on Twitter to avoid missing new wallaby.js app features announcements.
Almost 12 months ago we have started to sell first commercial licenses for wallaby.js, so on the 7th of May 2016 we are turning one year as a product. Like every business, we have had some ups and downs, but overall it’s been a great a year for us. We keep growing steadily, adding new features and improving the tool’s quality.
Some exciting and ambitious plans are prepared for the next year, some of them are very close for their first preview. But enough about the future plans, let’s see what we have already implemented in the last couple of months, and that you can use today.
One thing I’d like to mention before jumping to the new features, is our new License Upgrade and Renewal Calculator. Using the form you may quickly upgrade your existing license to ‘Freedom’ or renew your existing license. All you need to do is just to paste your existing license key(s) or an email with the keys, and the form will display pricing options tailored for your case.
Sublime Text integration
Many of you have been eagerly waiting so long for the integration. We have been brushing up the first preview version released earlier this year and finally Sublime Text integration beta program has ended earlier this month, so licenses are available for purchasing.
If you haven’t done it already, check out our tutorial and also make sure to upgrade to the latest version of the package in Sublime Text.
Electron runner support
Being able to run your tests in a headless browser, such as PhantomJs, is awesome for many reasons. Still, sometimes you may want to run your unit tests in a real browser, and not to just occasionally verify that your test suite passes in that browser, but in a continuous testing tool like wallaby.js as well.
For example, you may want to use the latest Chrome/V8 features, possibly without Babel, or use some features that Babel doesn’t support. Or you may want to TDD your way through some of your app features that are using Web Audio API (that PhantomJs doesn’t support). Or you just got tired of using various polyfills in your test environment.
Even though wallaby.js supports the latest PhantomJs builds, up until recently PhantomJs was the only option to run your unit tests in browser environment with wallaby. Now we also have added Electron test runner support.
It’s very simple to use: you just install the electron-prebuilt NPM package, specify kind: 'electron' in your env setting in wallaby config. That’s it, now you are ready to run your tests in the latest Chromium/V8 environment without any opened browsers windows and other related distractions.
AVA support
If you are doing node.js testing, then you have probably heard of, and maybe even are using, AVA testing framework and test runner. As a testing framework, AVA is minimal, has a simple test syntax and supports a few nice ways to write async tests (such as returning a promise or an observable, generator or async functions). As a test runner, AVA does a few cool things that wallaby.js brings to other testing frameworks, such as running tests files in separate processes.
We have started prototyping AVA support in wallaby.js a while ago and a few things changed in AVA since then. Now when the runner looks pretty stable, we are happy to announce that we have added its experimental support in wallaby.js.
Wallaby.js provides AVA tests many super-powers of a continuous test runner, including (but not limited to) reporting realtime code coverage and execution results right into your editor, like JetBrains IDEs (such as WebStorm), Visual Studio, Atom, VS Code and Sublime Text.
AVA itself is pretty fast, but wallaby is making AVA even faster by not only executing affected test files, but individual affected tests. So if you are changing an AVA test or some code covered just by that test, wallaby will only execute that test, not all tests in the test file.
Configuring AVA in wallaby.js is literally one line in addition to the rest of your wallaby.js configuration file:
Actually, you may use power-assert with any testing framework that wallaby.js supports. Just need to add babel-plugin-espower to your babel plugins list.
One more thing that is worth noting, is that unlike AVA, that forks a separate process per a test file, wallaby.js uses a pool of processes with a configurable capacity and optional process recycling to execute tests. We believe that wallaby.js approach is generally faster, and using a process per file may negatively affect the performance, especially if you have more than just few test files. Anyway, if you like, you may make wallaby.js to run tests as AVA does by just configuring wallaby to use a large number of processes and to recycle worker processes.
Angular 2 support
Angular 2 release date is approaching, and the framework can be used in many different ways: with TypeScript or ES6, System.js or Webpack/Browserify, JSPM or not. No matter what’s your preferred stack, we’d like to make it as easy as possible for you to test your ng2 apps with wallaby.js.
To help you configuring wallaby.js, we have prepared (and are keeping updated) a few sample projects using Angular 2 with wallaby.js and various combinations of technologies that you may use with it.
Miscellaneous
Don’t get upset if you haven’t found anything interesting for you in the announced features. We are doing a few releases every week, so you are still regularly getting improvements that affect your work with the tool. You may also check out the more detailed list of changes, below are some notable changes and fixes.
Function.prototype.bind polyfill for PhantomJs is now shipped with wallaby.js core, so if you are using some packages as polyfills, you may get rid of them. Note that those polyfills may still be required in you are running PhantomJs tests in Karma.
TypeScript 1.8 (and 1.9 dev) support.
Ongoing support for Webpack 2 beta changes. Also some significant performance improvements for larger Webpack projects (make sure to update wallaby-webpack package to latest).
Wallaby.js tests indicator for the Distraction Free mode (and Presentation mode) in JetBrains IDEs.
Support for the latest versions of Jest and Jasmine.
New Year celebrations are over, it’s time to open your editors and start crunching some code. And, of course, tests for the code. Unless you’d like it to become an unmaintainable mess pretty quickly, or just love the Page Refresh Driven development.
New editors
VS Code integration
First of all, I am happy to announce that today we are officially releasing wallaby.js VS Code integration. The beta program has been running for a couple of months and the integration have been tested by more than a thousand of our beta users, so we are pretty confident to proceed and start selling commercial licenses for it. Make sure to update the extension to the latest version to be able to enter your license key.
If you have tried wallaby.js for VS code, enjoyed it, and now just need to find a good way to convince your management to purchase licenses for the tool - just send your boss the link to this article by Scott Hanselman. Scott doesn’t need any introduction, especially if you come from the .NET world.
By the way, if you are a .NET developer or a company mostly using Microsoft development stack, then it’s definitely worth considering getting “Freedom” licenses to use wallaby.js in VS Code as well as in old good Visual Studio (and a few other editors that we support).
As usually, we are providing a free license key to keep using wallaby.js in VS Code for a couple more weeks, while you are making the decision whether to purchase the tool.
Sublime Text integration beta
The time has finally come to add +1000 intelligence to JavaScript code editing in one of the fastest text editors out there. Please welcome wallaby.js for Sublime Text editor!
We are planning to run the beta program for about 2 months, so you should have plenty of time to try the tool, even accomplish a project or two with it while it’s free.
Last but not least, I’d like to share a few notes about what we have added/improved recently:
Started simplifying configuration for TypeScript/CoffeeScript/Babel. Now you don’t have to pass babel or typescript instance in your configuration options. If wallaby finds the module locally installed, then it will use it. We also have some big plans to further simplify wallaby.js configuration process, your opinion is welcome.
Improved assertion data diff in Atom, check it out.
Improved error reporting from PhantomJs, say goodbye to those pesky Parse Error without stacks.
Improved chai (error stacks) and jasmine (pending tests) support.
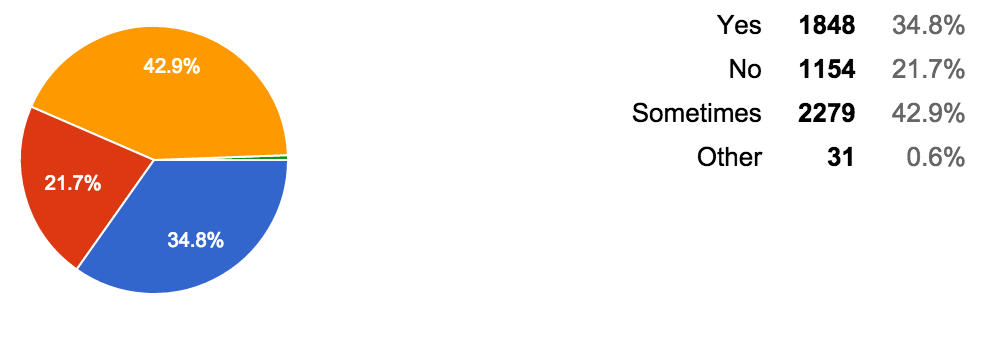
According to the recent JavaScript Developer Survey Results, ~78% of JavaScript developers write tests and 21.7% don’t write tests. It means that we, as a company, have the great market to keep growing, but still have a lot of work ahead to make JavaScript testing productive, affordable and fun for the rest 21.7%.
Do you write tests?
So how exactly are we making the JavaScript testing world better and planning to keep making it better?
New editors
VS Code integration beta
In case you have missed it, we have recently released the first beta of wallaby.js integration for Visual Studio Code. If you are using the editor or just planning to try it out, make sure you install wallaby.js extension and enjoy continuous testing in the powerful and streamlined editor.
There’re a few things we would like to improve in wallaby.js for Visual Studio Code during the beta period and some of these things require to add new features to the editor, but the great thing is that the editor is now open source, so we can start hacking it and submitting pull requests.
Sublime Text integration ETA
We have been approaching and prototyping it for the last few months, but, unlike JavaScript/TypeScript/CoffeeScript/Java/C#, Python and its ecosystem wasn’t something that we’ve had much experience with, so extending Sublime Text was going slower than we’d like it to go.
To speed things up, we have decided to expand our team and have hired a professional Python developer. I’m happy to share that we have made some significant progress, and also happy to announce that we are planning to release the first beta version of wallaby.js for Sublime Text in the next 2 months.
Strategic results and plans
For the last few months we have been expanding both vertically by adding new features and horizontally by supporting more editors.
During just over 10 months, we have released wallaby.js 240 times. It’s 4 live updates with new features and bug fixes during every 5 days. Apart from being a great way to deliver you the wallaby awesomeness fast and easy, frequent releases and hassle-free automatic updates is also our way to embrace the ever changing chaos of the JavaScript ecosystem.
The tool had grown from supporting only JetBrains IDEs initially to support Visual Studio, Atom, VS Code, and now we are working on Sublime Text 3. Adding the support of these 4 different editors (with the fifth on the way) within the 10 months time frame was a great way to bring wallaby.js to as many JavaScript developers as possible.
While we know that there’re more editors out there, we would like to take a break from adding more editor integrations and shift our focus on growing the product vertically. Apart from working on a few already requested features, like the test explorer, code coverage reports, and adding more test runners (such as Chrome and Electron), we are also planning to start working on a couple of truly amazing and innovative new features that will boost your productivity even further, so stay tuned.
Notable updates of the last few weeks
To conclude, I’d like to share a few notes about what we have added/improved recently:
Have added the documentation page and more samples for system.js. Make sure to have a look to see how to configure wallaby.js inline test error reporting for Angular 2, Aurelia and other system.js based projects.
Wallaby.js is a continuous test runner for JavaScript. It solves the fundamental issue of being able to provide an instant feedback from your tests as you write your code, no matter how large your codebase is. Wallaby.js uses smart dependency analysis to only execute tests affected by your code changes and leverages parallel test execution.
It also displays test execution results, including code coverage, right in your code editor. No context switching, no need to switch to browser - it’s game changing. The tool pays for itself very quickly and is bringing you to a whole new productivity level.
Now it’s time to bring the awesomeness of wallaby to Visual Studio Code editor. The streamlined and powerful editor plus the power of wallaby.js is a great combo to deal with JavaScript and TypeScript projects of any size fast and easy.
Setting up
Wallaby.js for Visual Studio Code consists of two separately versioned parts: wallaby.js Extension and wallaby.js Core.
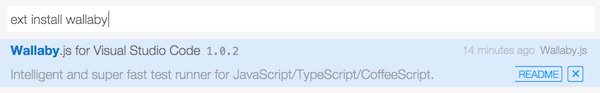
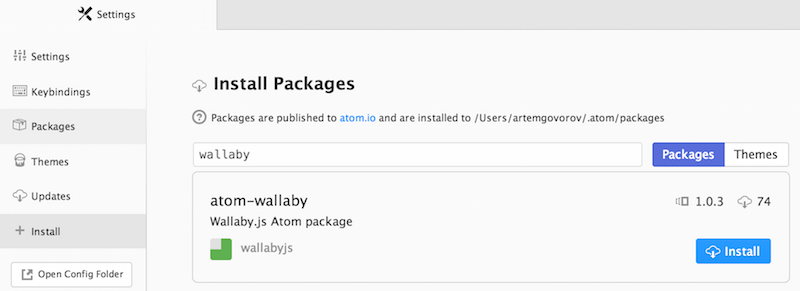
To get started, you need to install Wallaby.js Extension from your editor (using Extensions: Install Extension command).
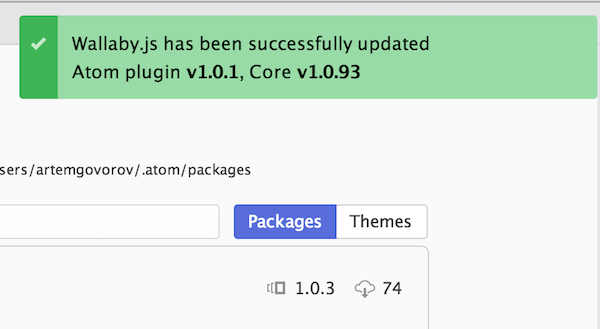
After the extension is installed, wallaby.js Core will be automatically downloaded and installed. Please note, that the very first time wallaby.js needs to download and install its dependencies, so it may take a minute or two. Further updates are much faster. The notification is displayed when the installation is finished.
Once you have the source code locally, open the project folder in Visual Studio Code.
There you will find a simple calculator project there with wallaby.js configuration file. Wallaby configuration file is a simple JSON or JavaScript file in your project root folder with just a couple of mandatory settings. The configuration file includes a list of files and tests of your application as well as some settings for various technologies that you may be using to build your project, such as Webpack or Browserify configuration Babel/CoffeeScript/TypeScript compiler options, etc.
Wallaby supports lots of technologies and scenarios, we have collection of sample projects with configuration files for different tools, frameworks and languages, such as Webpack, Browserify, ES6 and ES7 via Babel, TypeScript and CoffeeScript, React and Angular, node.js and io.js, etc.
First steps
Selecting wallaby.js config file
Wallaby.js for Visual Studio Code needs to know what configuration file to use to run your tests. If you only have one file named wallaby.js/wallaby.conf.js or wallaby.json in your project root, wallaby will automatically select it.
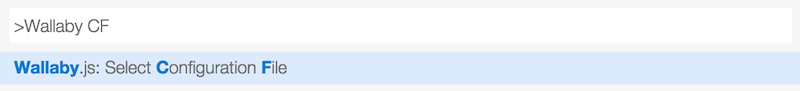
However, if you have multiple configuration files, use different naming convention or have the config file not in the root folder, you may select the config file using Wallaby.js: Select Configuration File command from the editor Command Palette.
Wallaby.js Command Palette
As you probably know, you may press Ctrl/Cmd + Shift + P in Visual Studio Code to get the editor Command Palette in case if you’ve forgotten some shortcuts or just like invoking commands this way. There you may search for wallaby and use the found commands.
Also, for your convenience wallaby.js adds its own Command Palette to the editor that you may display by pressing Ctrl/Cmd + Shift + =. It’s a fast and easy way to quickly use various wallaby features.
Now let’s have some fun.
Let’s try starting wallaby.js: to do that you need to invoke wallaby Start command. You may do it by using the Ctrl/Cmd + Shift + R, R shortcut, or using wallaby Command Palette.
To stop wallaby.js, you may use the Stop command.
Wallaby.js in action
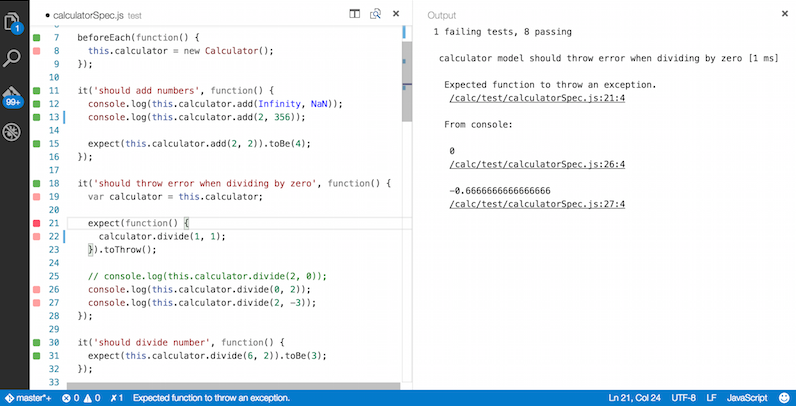
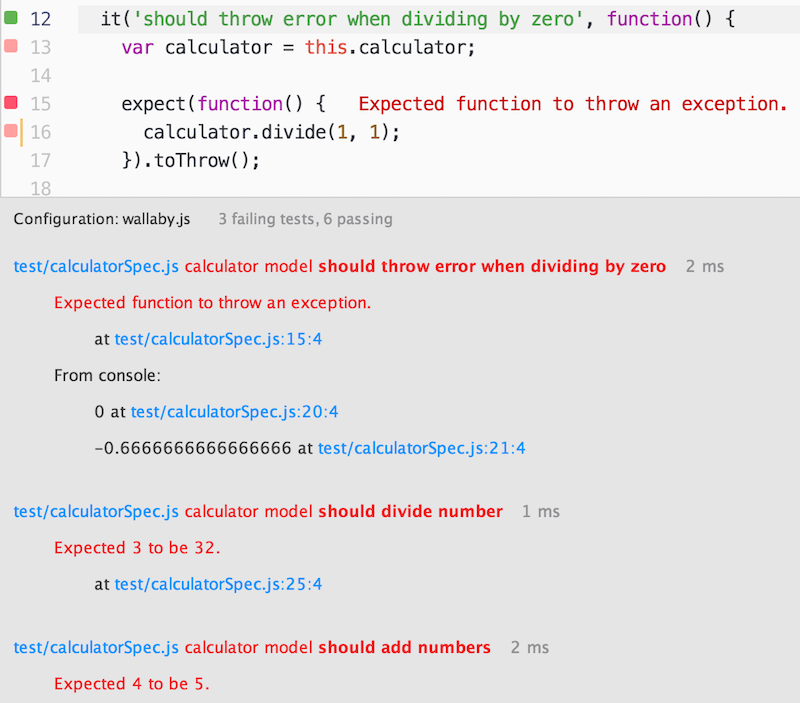
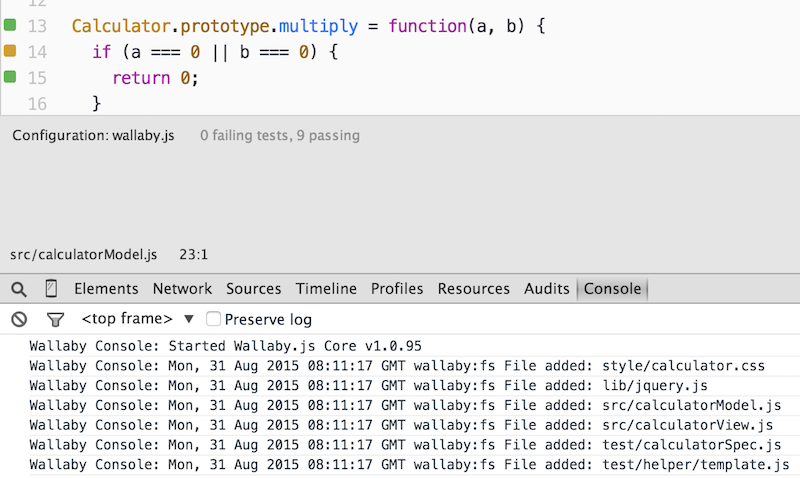
Once you have started wallaby.js, at the bottom left corner of the editor you’ll see wallaby status indicator. It’s job is pretty simple: when it displays a spinner - your tests are running, when it shows a cross - you have some failing tests, when it shows a tick - all of your tests are passing. It also shows the number of failing or passing tests, and you may also use the indicator to show ‘Wallaby.js Tests’ Output Channel by clicking it.
Now, let’s open the sample calculator project spec (test/calculatorSpec.js).
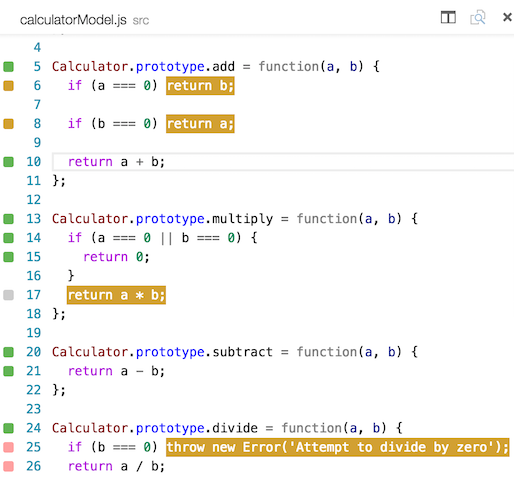
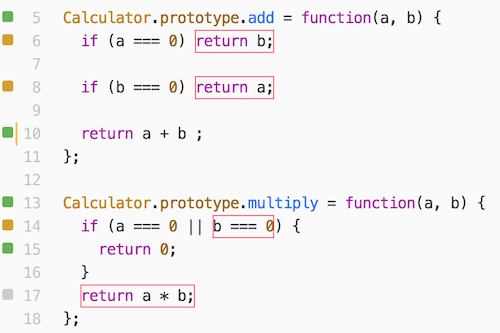
When wallaby.js is running, you can see the code coverage in opened source files (specified in wallaby configuration file). As you can see, there are various colored squares displayed for each line of your source code.
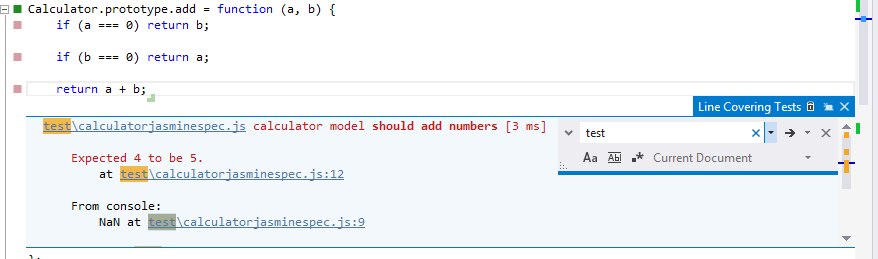
Try jumping to any of the passing tests and break it, for example try changing the 2 plus 2 expectation result to 5 in the should add numbers test, or try breaking the code covered by the test. Right after the change wallaby.js automatically runs your tests and displays the result in status bar.
The code coverage and messages are automatically updated, just as you type.
Also, try editing some console.log arguments or just console.log any object you like.
This is a great way to quickly inspect any objects without having to leave your editor, without switching to any other console. Think how cool it is - your code editor is your console with all the required context.
Coverage indicators
Let’s have a look at the editor gutter where you may see some indicators. Here is what these coverage indicators mean:
Gray square means that the source line is not covered by any of your tests.
Green square means that the source line is covered by at least one of your tests.
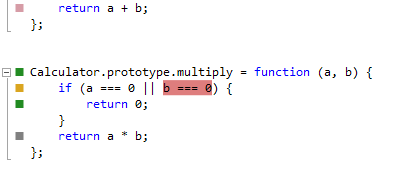
Yellow square means that the source line is only partially covered by some of your tests.
Red square means that the source line is the source of an error or failed expectation, or is in the stack of an error.
Pink square means that the source line is on the execution path of a failing test.
Failing tests
‘Wallaby.js Tests’ Output Channel displays all tests that are currently failing along with the error stacks and registered console.log calls. Some bits of the displayed information are hyperlinks so you can navigate to different places, for example to the exact error line, or a line where something is logged to console. To quickly focus the panel you may use the Show Failing Tests wallaby command (Ctrl/Cmd + Shift + R, T).
Commands
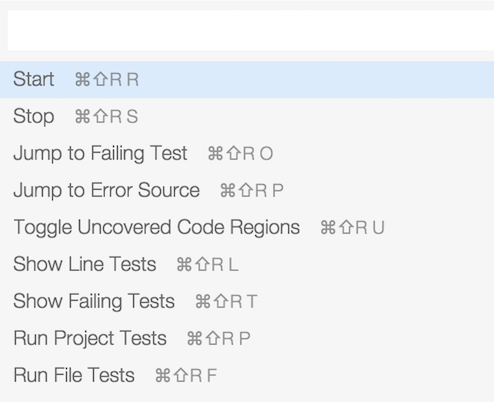
To help you writing/navigating your code and tests more efficiently, wallaby.js provides a few commands. You may see the full list in the wallaby.js Command Palette (Ctrl/Cmd + Shift + =).
These commands include:
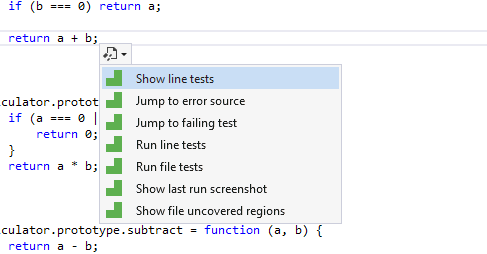
Show line tests: displays the line related test data. The command allows you to quickly view all tests (both failing and passing) that cover the current line of code, navigate to test and code errors, view console messages related to some specific test or some source code line.
Jump to failing test: allows to quickly navigate to the failing test from any ‘pink’ context (the failing test execution path).
Jump to error source: allows to quickly navigate to the source of the test error from any ‘pink’ context (failing test execution path).
Toggle uncovered regions: displays/hides uncovered regions for an opened file. The command is very useful for ‘yellow’ lines to display what is exactly not covered in the line. Highlighted markers will automatically disappear when you start editing your code.
Run line tests: the command is pretty simple, it just runs a single test (if invoked from within the test) or all related tests (if invoked within some source code covered by the tests).
Run file tests: the command runs all tests within the test file it is invoked in, or all tests in all the test files that cover the source file that the command is invoked within.
Run project tests: the command runs all project tests.
Troubleshooting
If you encounter any issues with configuring or using wallaby.js and not sure why it happens, check out our troubleshooting docs section or search our public repository issues to see if someone else have been experiencing something similar.
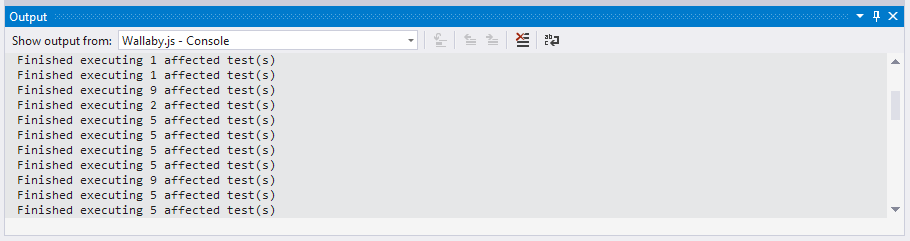
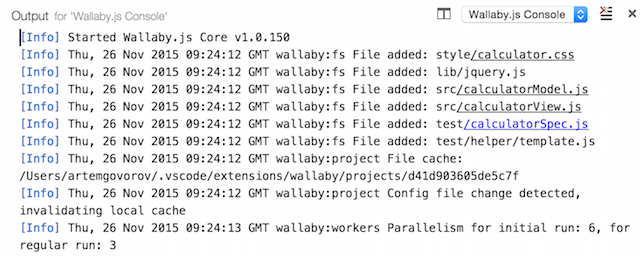
Another useful technique is to run wallaby.js with the debug flag set to true. In this case wallaby outputs a lot of additional information about the test execution progress which may help you to understand what’s going on if something goes wrong. The output can be viewed in the Wallaby.js Console Output Channel.
Consider getting yourself a copy of ‘Freedom’ license today to help the project and be able to use wallaby.js in any editor that we support today and will support in future.
Wallaby.js is a continuous test runner for JavaScript. It solves the fundamental issue of being able to provide an instant feedback from your tests as you write your code, no matter how large your codebase is. Wallaby.js uses smart dependency analysis to only execute tests affected by your code changes and leverages parallel test execution.
It also displays test execution results, including code coverage, right in your code editor. No context switching, no need to switch to browser - it’s game changing. The tool pays for itself very quickly and is bringing you to a whole new productivity level.
When wallaby.js was released early this year, it was supporting only IntelliJ platform IDEs, such as WebStorm and IntelliJ IDEA, a few months ago we have added Visual Studio support. Now it’s time to bring the awesomeness of wallaby to Atom text editor. The lightweight and elegant editor plus the power of wallaby.js is a great combo to deal with JavaScript projects of any size fast and easy.
Setting up
Wallaby.js for Atom consists of three separately versioned parts: Atom Package, wallaby.js Plugin and wallaby.js Core.
To get started, you need to install wallaby.js Atom package from your editor (Settings - Install).
After the package is installed, wallaby.js Plugin and wallaby.js Core will be automatically downloaded and installed. The Atom package is just a loader/updater of wallaby.js Plugin and Core, it gets updated quite infrequently and does it the same way as all other Atom packages that you may have installed.
Wallaby.js Plugin and wallaby.js Core on the other hand are updated more frequently, the update is performed automatically behind the scenes and the notification is displayed when the update is finished.
Once you have the source code locally, open the project folder in Atom.
There you will find a simple calculator project there with wallaby.js configuration file. Wallaby configuration file is a simple JSON or JavaScript file in your project root folder with just a couple of mandatory settings. The configuration file includes a list of files and tests of your application as well as some settings for various technologies that you may be using to build your project, such as Webpack or Browserify configuration Babel/CoffeeScript/TypeScript compiler options, etc.
Wallaby supports lots of technologies and scenarios, we have collection of sample projects with configuration files for different tools, frameworks and languages, such as Webpack, Browserify, ES6 and ES7 via Babel, TypeScript and CoffeeScript, React and Angular, node.js and io.js, etc.
First steps
Selecting wallaby.js config file
Wallaby.js for Atom needs to know what configuration file to use to run your tests. If you only have one file named wallaby.js/wallaby.conf.js or wallaby.json in your project root, wallaby will automatically select it.
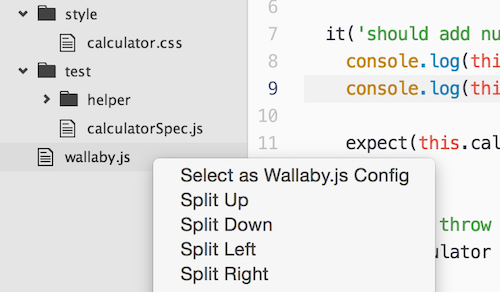
However, if you have multiple configuration files, use different naming convention or have the config file not in the root folder, you may select the config file from the Tree View with context menu or by opening the config in an editor tab and using Select as Wallaby.js Config context menu item.
Wallaby.js Command Palette
As you probably know, you may press Ctrl/Cmd + Shift + P in Atom to get the editor Command Palette in case if you’ve forgotten some shortcuts or just like invoking commands this way. There you may search for wallaby and use the found commands.
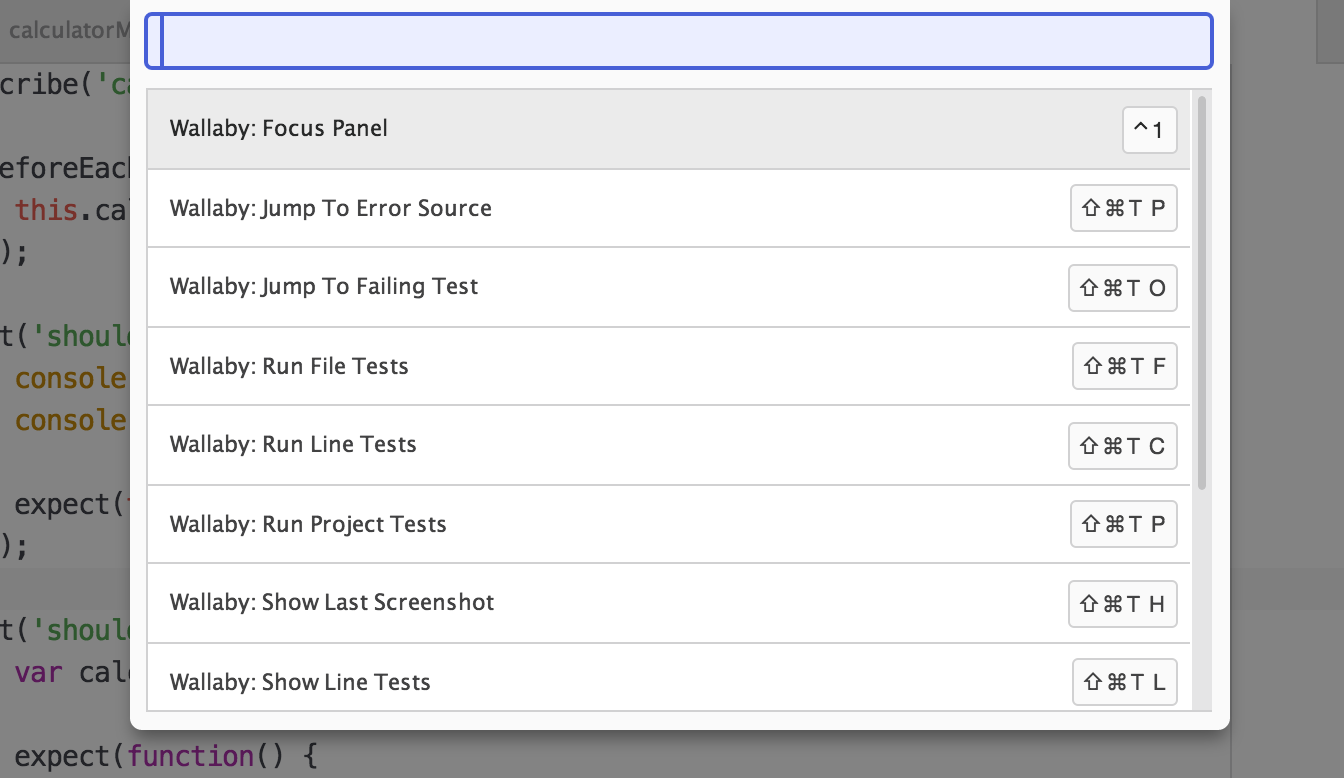
Also, for your convenience wallaby.js adds its own Command Palette to Atom that you may display by pressing Ctrl/Cmd + Shift + Space. It’s a fast and easy way to quickly use various wallaby features.
Wallaby.js Panel
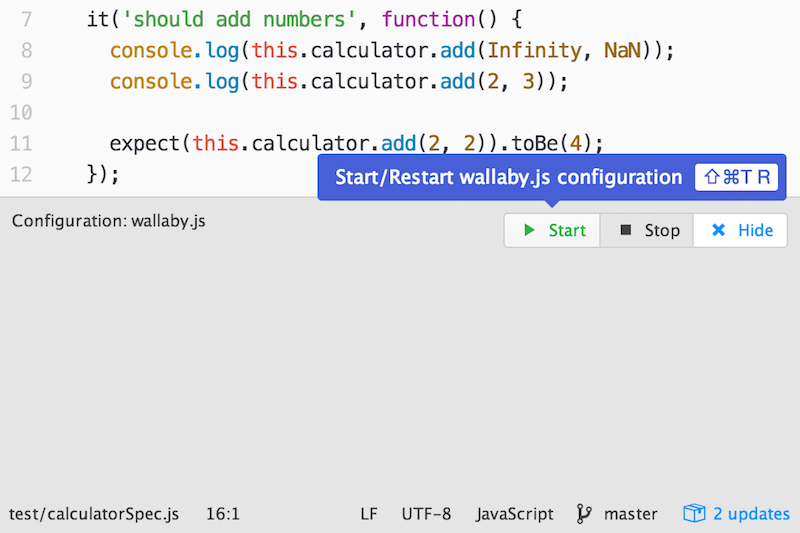
One of the things you’ll be using a lot is wallaby.js Panel. It displays the name of the selected config file, failing test results as well as some test stats. You can open and collapse it by using the corresponding command (from the palette or via Ctrl/Cmd + Shift + T, T shortcut).
Let’s try starting wallaby.js: to do that you need to invoke wallaby Start command. You may do it by using the Ctrl/Cmd + Shift + T, R shortcut, or using wallaby Command Palette, or by clicking Start button on the wallaby.js Panel.
To stop wallaby.js, you may use Stop command or Stop button on the wallaby.js Panel.
Now let’s have some fun.
Wallaby.js in action
Once you have started wallaby.js, at the bottom right corner of the editor you’ll see wallaby status indicator. It’s job is pretty simple: when it displays a spinner - your tests are running, when it’s red - you have some failing tests, when it’s green - all of your tests are passing. You may also use the indicator to toggle wallaby.js Panel by clicking it.
Now, let’s open the sample calculator project spec (test/calculatorSpec.js).
When wallaby.js is running, you can see the code coverage in opened source files (specified in wallaby configuration file). As you can see, there are various colored squares displayed for each line of your source code.
Try jumping to any of the passing tests and break it, for example try changing the 2 plus 2 expectation result to 5 in the should add numbers test, or try breaking the code covered by the test. Right after the change wallaby.js automatically runs your tests and displays the result in Atom, right where you need to see it.
The code coverage and inline messages are automatically updated, just as you type.
Also, try editing some console.log arguments or just console.log any object you like.
This is a great way to quickly inspect any objects without having to leave your editor, without switching to any other console. Think how cool it is - your code editor is your console with all the required context.
Coverage indicators
Let’s have a look at the editor gutter where you may see some indicators. Here is what these coverage indicators mean:
Gray square means that the source line is not covered by any of your tests.
Green square means that the source line is covered by at least one of your tests.
Yellow square means that the source line is only partially covered by some of your tests.
Red square means that the source line is the source of an error or failed expectation, or is in the stack of an error.
Pink square means that the source line is on the execution path of a failing test.
Any indicator click triggers Show line tests command which we will review later.
Failing tests
Wallaby.js Panel displays all tests that are currently failing along with the error stacks and registered console.log calls. Some bits of the displayed information are hyperlinks that you can use with your mouse or keyboard (Enter) to navigate to different places, for example to the exact error line, or a failing test, or a place where something is logged to console. To quickly focus the panel you may use the Focus Panel wallaby command (Ctrl + 1), pressing Esc will return the focus back to the editor.
Commands
To help you writing/navigating your code and tests more efficiently, wallaby.js provides a few commands. You may see the full list in the wallaby.js Command Palette (Ctrl/Cmd + Shift + Space).
These commands include:
Show line tests: displays the line related test data. The command allows you to quickly view all tests (both failing and passing) that cover the current line of code, navigate to test and code errors, view console messages related to some specific test or some source code line.
Jump to failing test: allows to quickly navigate to the failing test from any ‘pink’ context (the failing test execution path).
Jump to error source: allows to quickly navigate to the source of the test error from any ‘pink’ context (failing test execution path).
Toggle uncovered regions: displays/hides uncovered regions for an opened file. The command is very useful for ‘yellow’ lines to display what is exactly not covered in the line. Highlighted markers will automatically disappear when you start editing your code.
Run line tests: the command is pretty simple, it just runs a single test (if invoked from within the test) or all related tests (if invoked within some source code covered by the tests).
Run file tests: the command runs all tests within the test file it is invoked in, or all tests in all the test files that cover the source file that the command is invoked within.
Run project tests: the command runs all project tests.
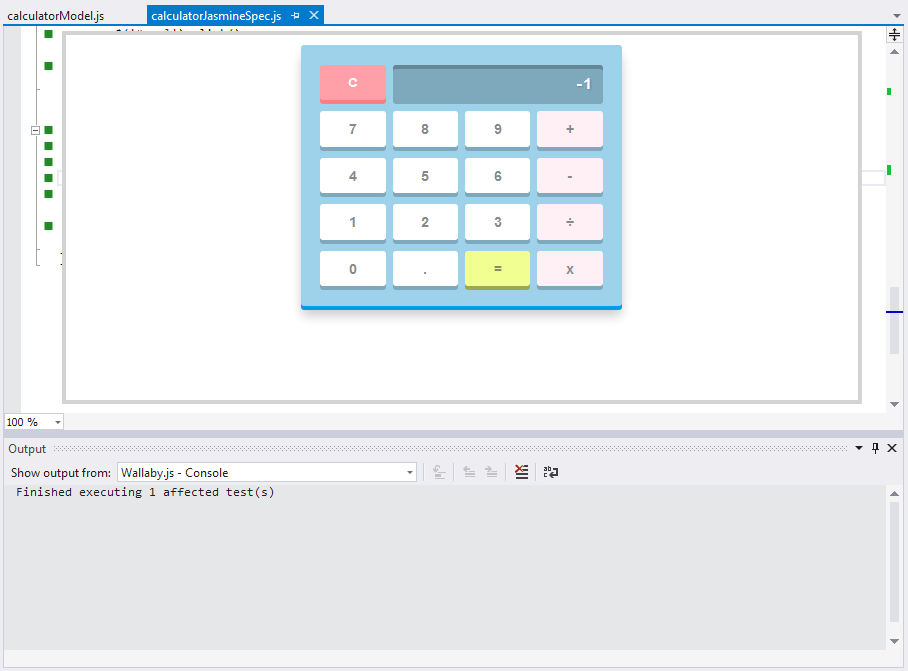
Show last run screen shot: the command just does what it says. After every test run, wallaby.js captures a screen shot of the generated test runner page, so if you have some tests that are displaying anything - the command could be useful for you. Very powerful combo is using the command together with the Run line tests - you run a specific test, then view the screen shot for the test. Please note that you may often have some ‘tear down’ code, that clears the DOM before or after each test - wallaby.js is smart enough to capture the screenshot before the tear down code. Atom automatically updates the screen shot file when it’s changed, that allows you to have ‘live’ preview right in your editor.
Troubleshooting
If you encounter any issues with configuring or using wallaby.js and not sure why it happens, check out our troubleshooting docs section or search our public repository issues to see if someone else have been experiencing something similar.
Another useful technique is to run wallaby.js with the debug flag set to true. In this case wallaby outputs a lot of additional information about the test execution progress which may help you to understand what’s going on if something goes wrong. The output can be viewed in the Developer Tools Console (Ctrl/Cmd + Alt + I).
Consider getting yourself a copy of ‘Freedom’ license today to help the project and be able to use wallaby.js in any editor that we support today and will support in future.
My last blog post was about mighty knights of JavaScript testing, today it’s turn of the Holy Grail of JavaScript Testing.
So I was watching this video the other day, and while the purpose of the video is to demonstrate how to set things up and get started, the end of it really reminded me about the pain I had to experience before I created wallaby.js.
If you watch the last minute of the video (from 3:14), you’ll surely notice that
to accomplish one simple task of writing a test, the author had to switch context several times between three different applications - terminal, code editor and browser test page;
code coverage is missing (and when present, may add the fourth application to keep switching to);
larger application will take a few seconds to build and a few more to run your tests.
Of course, there are a few solutions that may get you closer to a better workflow, such as a file watcher via gulp or grunt, karma with webpack plugin, etc. I have previously spent many hours trying to get closer to what I think the modern productive automated testing workflow should look like.
And I failed. There are just too many moving parts to stitch together - even if or when it all works, the whole thing is far from satisfying my list of requirements. It’s like trying to build something from a pile of LEGO bricks with a few non-matching and few missing bits and pieces.
Don’t get me wrong. I love small tools, when each one is doing one thing well. It’s nice to be able to choose a testing framework, a module bundler, language dialect, a transpiler, an application framework, a code editor, etc., as opposed to be forced to use a monolith from a single vendor.
But once I’m happy about each and every part, I want them to work together smoothly. When I write my code with tests, I’m doing just one thing - I am writing my code with tests. So I need a tool that would allow me to to do this one thing well.
Also, to be fair, my expectations for the modern and productive testing workflow are pretty high. I sometimes do JavaScript TDD, sometimes I am using some mixed approach where I write some of my code first, but either way:
I’m too lazy to save files to run my tests. Code changes should be enough as a trigger.
I don’t want to wait too much for my tests to finish running. Running the whole suite when a single test or file changes just doesn’t cut anymore.
I don’t like to leave my code editor to see the feedback from my tests. Hate apps/context switching. Docked tool windows or a console/terminal/browser next to my code editor - are still distracting.
In 1995, Earth has become a JavaScript faring Federation. While colonizing new web technologies, humans have encountered an insectoid species known as “Bugs”. The bugs appear to be little more than killing machines, though there are suggestions that they were provoked by the intrusion of humans into their habitats.
I have taken a few lines from the “Starship Troopers” plot summary, but it sometimes feels like comparing to the Federation tech, we are still like medieval knights with our JavaScript weapons. Especially when killing bugs, or doing automated testing.
Hail fellow, I bid thee welcome, and ask you to join my journey to the cellars of the JavaScript testing armory.
Clubs
Our great ancestors, who stood shoulder to shoulder against the first bugs, used alert. Legendary spiked club, it crushed many simple enemies.
It’s glorified version console.log, or a morning star, is used nowadays. It may cause some confusion in enemy rear areas, but is not good enough to be used as a systematic approach for significant size battles.
Swords
Testing frameworks, or swords, are the main weapons in our merciless fights.
QUnit, or the Gladius. Quite old and oddly looking to some modern knights, it covered itself with glory in jQuery lands. Used to be, and for many remains, a very fearsome weapon.
Jasmine, or the Great sword. Large and two-handed sword in a sense that you don’t need anything else in your hands. It comes with the expectation framework and out-of-box mocking support. What else does a good knight need to kill a dozen or two of bugs with?
Mocha, or the Arming sword. Being simpler, smaller and faster, it allows to carry something else, such as an assertion library of your choice to make your bug enemies look miserable. Not only the sword can be you best friend in the land of JavaScript, but also in the Seas of Node.js.
Shields
Various application frameworks are like shields. Many knights love sitting around the Round Table of Internet and debate days and nights which shield is better. For smaller battles, you may be fine without it or with your own one. For larger battles, some good and tested by other knights shield will better protect you from certain bugs.
Siege engines
Browser automation tools and E2E testing frameworks, like Selenium, WebDriver, Protractor, etc. are the siege engines of testing. Like catapult, ballista or trebuchet, they are bulky, slow and hard to set up. Nevertheless, when up and shooting, will do a good job in destroying the enemy’s rampart.
Armour
Code editors is our armour, that’s what we spend endless battles with bugs in. Blacksmiths from different kingdoms all over the world are doing the great job to satisfy any knight’s taste.
Some armour is heavy and large but solid, some is smaller and more lightweight but may require a few patches here and there.
JavaScript is the main language we, mighty knights, speak. However, many of us have learned to record our wisdom in other languages and dialects. From far away lands of C# and Ruby, TypeScript and CoffeeScript came to help us in our war. From across the Seas of Node.js, CommonJs reinforcements have arrived. Even within our homeland, the language evolves and we more often hear minstrels singing glorious tales in ES6 or ES7.
In order to make it work against our enemies, we need some magic. Opening a scroll with a good TypeScript or ES7 spell and using it together with a potion of Babel Transpilation, sorcery of Webpack and Browserify or witchcraft of require.js, we make even our strongest bug enemies shake in fear.
Squires
Squires, or testing tools - are our humble servants. They more or less know your weaponry and armour, your spells chest content. Some ascetic knights can travel and fight without them, but normally a knight has a few.
Grunt and Gulp, brothers from one mighty but peaceful clan, with a few less known relatives. The brothers are strong and brave, and can even run your tests, but they were born to build your castle, not to slay bugs.
HTML test page. Easy and responsive chap, but a bit dumb and you need to poke him to make him work. You need to tell him what to do (add your scripts and tests) and when. Page refresh driven development in all of its beauty.
JSTestDriver. Old man from the Google kingdom. Hard-working and with Java in his heart, he had spent his best years running our countless tests. Knows when to run your tests, certain armour types friendly.
Karma. JSTestDriver’s son, who has taken the best from his father. Supports some armour types, very open fellow. As his father, Karma knows when to run your tests, but has no idea what tests to run, so just runs them all. It makes him perfect for some smaller battles, but he is a bit slow for medium and especially large ones. Also, Karma can’t swim the Seas of Node.js.
Wallaby.js. Highly skilled mercenary, specially trained to continuously kill bugs and do it fast. Not only he knows when to run your tests, he also knows how to run only those that are affected by your changes. Proficient with pretty much every weapon, shield and magic type listed in the article. Knows how to mix them well, more than just friendly to certain armour types. For a few gold coins in the nearby tavern you may get yourself a great helper for a battle of any size.
Fare thee well, mighty knights! Choose your weapons wisely and let there be no mercy for the bugs.
Wallaby.js is a continuous test runner for JavaScript. It solves the fundamental issue of being able to provide an instant feedback from your tests as you write your code, no matter how large your codebase is. Wallaby.js uses dependency analysis to only execute tests affected by your code changes and leverages parallel test execution.
It also displays test execution results, including code coverage, right in your code editor. If you have used NCrunch for C#, then many of wallaby.js UI concepts will be familiar to you.
Up until recently wallaby.js only supported IntelliJ platform editors, such as WebStorm and IntelliJ IDEA. Today I am happy to announce that wallaby.js adds support for Visual Studio 2013 (Update 4; Community, Professional, Premium and Ultimate editions).
Setting up
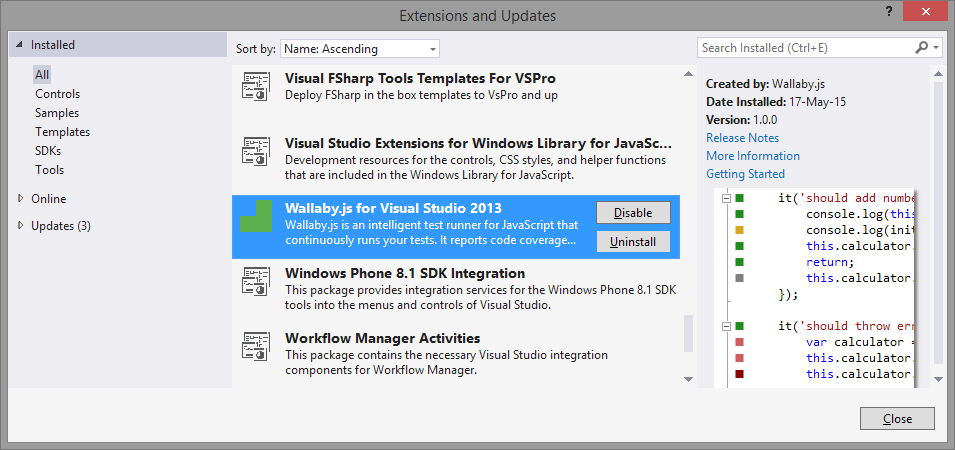
First, you need to download wallaby.js VSIX from our website and install it in your Visual Studio. Once installed, wallaby.js may be managed as all other “Extensions and Updates”.
Once you have the source code locally, open sample/visualstudio/Wallaby-Sample.sln solution.
You will find a simple calculator project there and a few wallaby configuration files for different testing frameworks. Wallaby configuration file is a simple JSON or JavaScript file in your project root folder with just a couple of mandatory settings.
Wallaby supports lots of technologies, we have collection of sample projects with configuration files for different tools, frameworks and languages, such as Webpack, Browserify, ES6 and ES7 via Babel, TypeScript and CoffeeScript, React and Angular, node.js and io.js, etc.
First steps
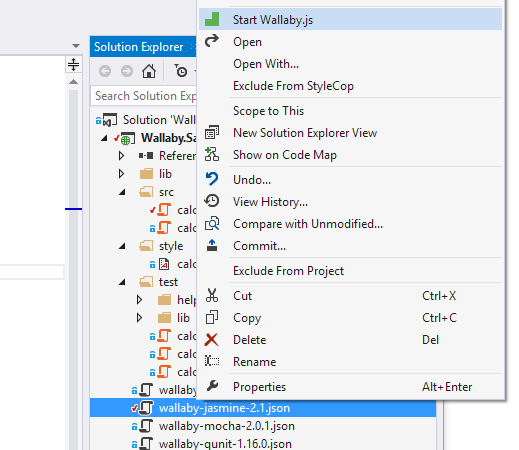
In this sample we will be using vanilla JavaScript. Let’s try starting wallaby.js: right click on the wallaby-jasmine-2.1.json configuration file in the Solution Explorer and select Start Wallaby.js from context menu. Wallaby will start with selected configuration file.
To stop wallaby.js, you may use Stop Wallaby.js context menu item.
The very first time you run it, wallaby.js may take a minute or two to install all the dependencies it needs, such as node.js and PhantomJs. It only does this once and then uses the saved dependencies. The dependencies are updated automatically when required.
Now let’s have some fun.
Code coverage
Once you have started wallaby.js, in the bottom right corner of the screen you’ll see wallaby status indicator. It’s job is pretty simple: when it displays a spinner - your tests are running, when it’s red - you have some failing tests, when it’s green - all of your tests are passing.
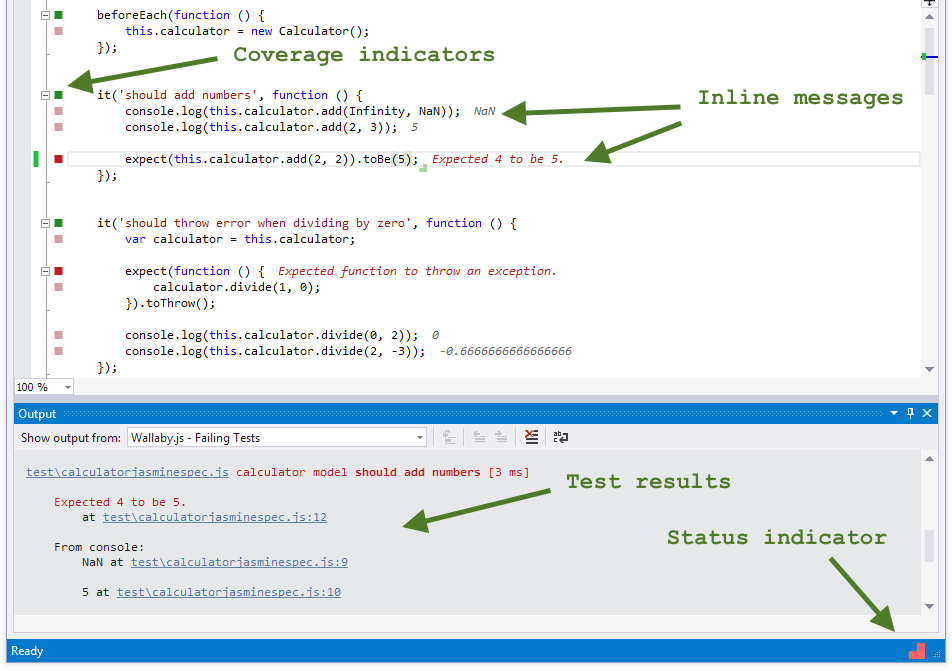
When wallaby.js is running, you can see the code coverage in the source files that it tracks (specified in the configuration file). As you can see, there are various colored squares displayed for each line of your source code.
Jump to any of the passing tests and break it, for example try changing the 2 plus 2 expectation result to 5 in the should add numbers test. Right after the change wallaby.js automatically runs your tests and displays the result in Visual Studio, right where you need to see it.
Also, try editing some console.log arguments or just console.log any object you like.
The code coverage and inline messages are automatically be updated, just as you type.
Here is what coverage indicators mean:
Gray square means that the source line is not covered by any of your tests.
Green square means that the source line is covered by at least one of your tests.
Yellow square means that the source line is only partially covered by some of your tests.
Red square means that the source line is the source of an error or failed expectation, or is in the stack of an error.
Pink square means that the source line is on the execution path of a failing test.
You may also inspect wallaby.js output in the Output tool window. In the tool window you may view output from Failing Tests tab and Console.
Failing Tests output source displays all tests that are currently failing along with the error stacks and registered console.log calls. Some bits of the displayed information are hyperlinks that you can use with your mouse (Ctrl + mouse click) or keyboard (F12) to navigate to different places, for example to the exact error line, or a failing test, or a place where something is logged to console.
Console output source displays some additional information about test execution progress. The tab can also be useful for troubleshooting wallaby.js issues.
Smart actions
To help you writing your code and tests more efficiently, wallaby.js provides a few smart actions available by clicking wallaby smart actions icon or pressing Ctrl + . on any line.
The actions include:
Show line test(s) action: displays the line related test data. This is the most frequently used action that allows you to quickly view and navigate to test and code errors, console messages related to some specific test or some source code line.
Jump to failing test action: allows to quickly navigate to the failing test from any “pink” context (the failing test execution path).
Jump to error source action: allows to quickly navigate to the source of the test error from any “pink” context (failing test execution path).
Show line uncovered regions: the action is useful for “yellow” lines to display what is exactly not covered in the line. Not covered expressions will be highlighted in red.
Show file uncovered regions: the action is similar to the previous one, it displays uncovered regions for the whole file. The red highlights for both actions can be removed by pressing Esc (or you can just start changing the file code and they will disappear).
Run line test(s): the action is pretty simple (yet so much wanted by so many people), it just runs a single test (if invoked from within the test) or all related tests (if invoked within some source code covered by the tests).
Run file test(s): the action runs all tests within the test file it is invoked in, or all tests in all the test files that cover the source file that the action is invoked within.
Show last run screen shot: the action just does what it says. After every test run, wallaby.js captures a screen shot of the generated test runner page, so if you have some tests that are displaying anything - the action could be useful for you. Very powerful combo is using the action together with the Run line test(s) - you run a specific test, then view the screen shot for the test. Please note that you may often have some “tear down” code, that clears the DOM before or after each test - wallaby.js is smart enough to capture the screenshot before the tear down code.
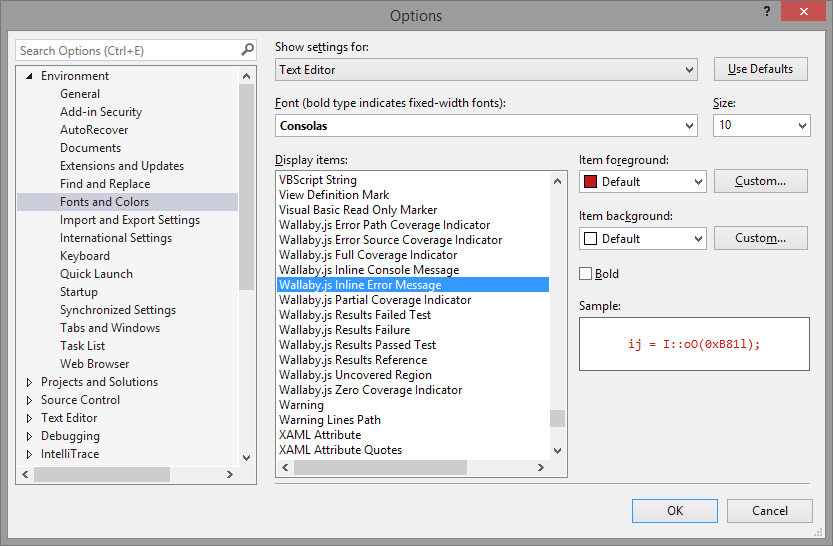
Fonts and colors
If some of wallaby.js default colors don’t fit your theme, it’s very easy to adjust.
Consider getting yourself a copy of “Freedom” license today to help the project and be able to use wallaby.js in any editor that we support today and will support in future.


 Do you write tests?


 Some armour is heavy and large but solid, some is smaller and more lightweight but may require a few patches here and there.
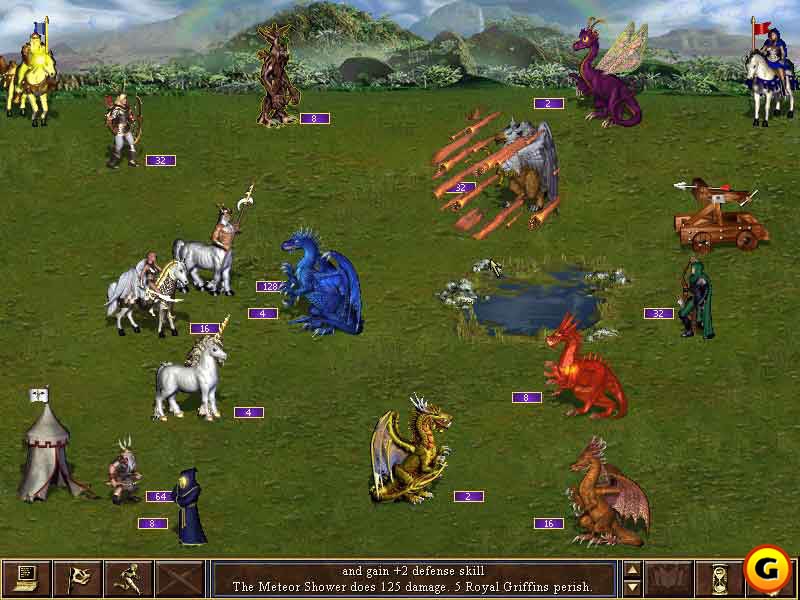

 HTML test page. Easy and responsive chap, but a bit dumb and you need to poke him to make him work. You need to tell him what to do (add your scripts and tests) and when. Page refresh driven development in all of its beauty.