Wallaby.js for Visual Studio
Wallaby.js is a continuous test runner for JavaScript. It solves the fundamental issue of being able to provide an instant feedback from your tests as you write your code, no matter how large your codebase is. Wallaby.js uses dependency analysis to only execute tests affected by your code changes and leverages parallel test execution.
It also displays test execution results, including code coverage, right in your code editor. If you have used NCrunch for C#, then many of wallaby.js UI concepts will be familiar to you.
Up until recently wallaby.js only supported IntelliJ platform editors, such as WebStorm and IntelliJ IDEA. Today I am happy to announce that wallaby.js adds support for Visual Studio 2013 (Update 4; Community, Professional, Premium and Ultimate editions).
Setting up
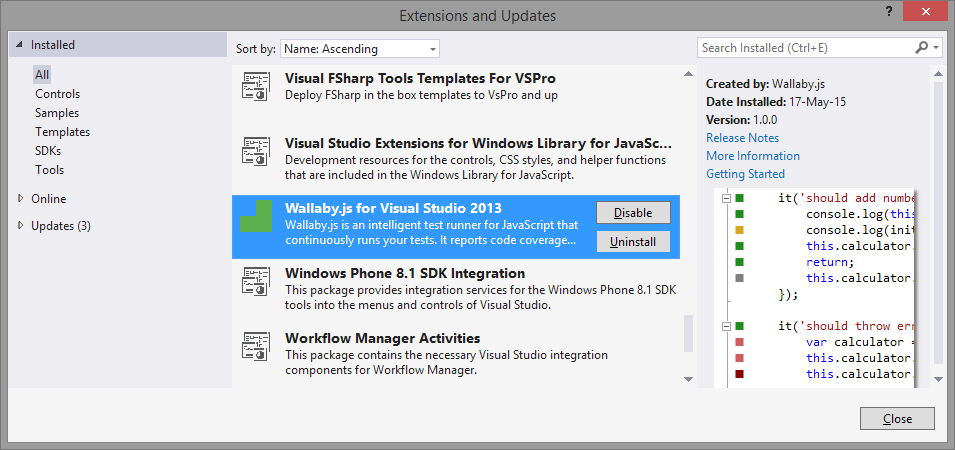
First, you need to download wallaby.js VSIX from our website and install it in your Visual Studio. Once installed, wallaby.js may be managed as all other “Extensions and Updates”.
For this blog post I will use this sample from our public GitHub repository. You can clone it to try locally:
git clone https://github.com/wallabyjs/public
or just download the zip file with the source code.
Once you have the source code locally, open sample/visualstudio/Wallaby-Sample.sln solution.
You will find a simple calculator project there and a few wallaby configuration files for different testing frameworks. Wallaby configuration file is a simple JSON or JavaScript file in your project root folder with just a couple of mandatory settings.
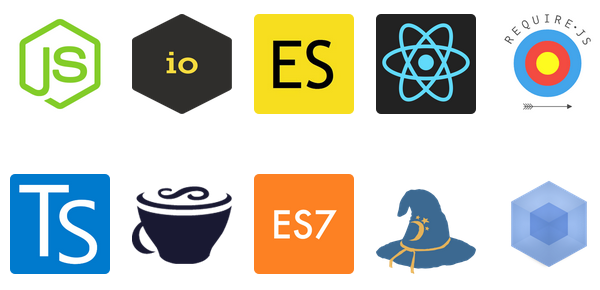
Wallaby supports lots of technologies, we have collection of sample projects with configuration files for different tools, frameworks and languages, such as Webpack, Browserify, ES6 and ES7 via Babel, TypeScript and CoffeeScript, React and Angular, node.js and io.js, etc.
First steps
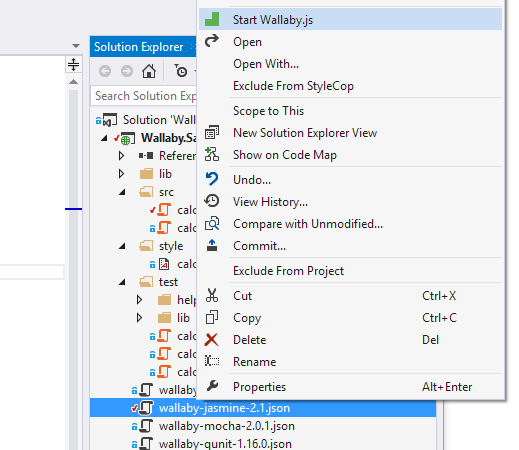
In this sample we will be using vanilla JavaScript. Let’s try starting wallaby.js: right click on the wallaby-jasmine-2.1.json configuration file in the Solution Explorer and select Start Wallaby.js from context menu. Wallaby will start with selected configuration file.
To stop wallaby.js, you may use Stop Wallaby.js context menu item.
The very first time you run it, wallaby.js may take a minute or two to install all the dependencies it needs, such as node.js and PhantomJs. It only does this once and then uses the saved dependencies. The dependencies are updated automatically when required.
Now let’s have some fun.
Code coverage
Once you have started wallaby.js, in the bottom right corner of the screen you’ll see wallaby status indicator. It’s job is pretty simple: when it displays a spinner - your tests are running, when it’s red - you have some failing tests, when it’s green - all of your tests are passing.
Let’s open the sample calculator Jasmine spec.
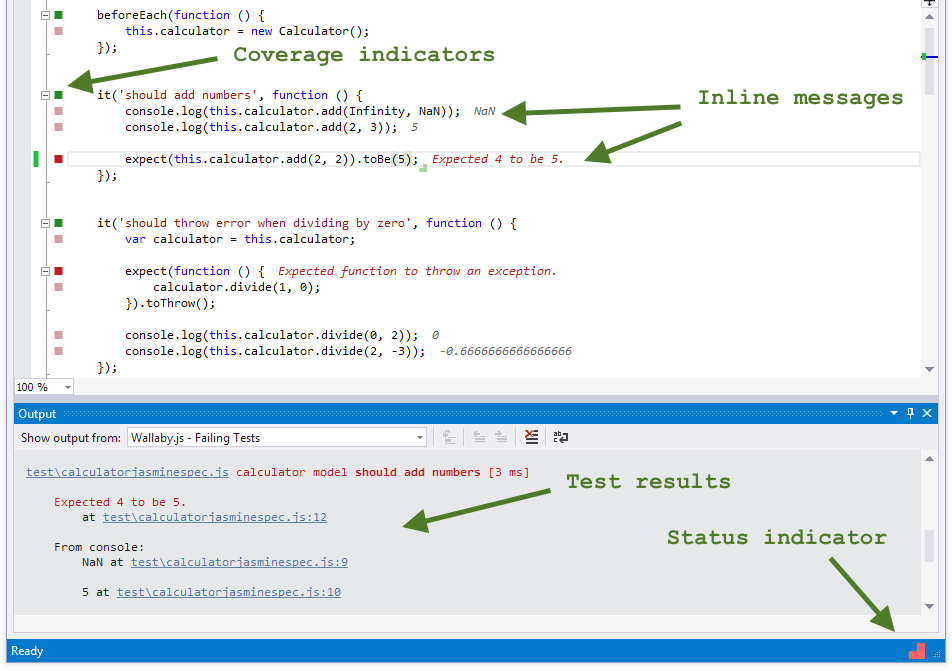
When wallaby.js is running, you can see the code coverage in the source files that it tracks (specified in the configuration file). As you can see, there are various colored squares displayed for each line of your source code.
Jump to any of the passing tests and break it, for example try changing the 2 plus 2 expectation result to 5 in the should add numbers test. Right after the change wallaby.js automatically runs your tests and displays the result in Visual Studio, right where you need to see it.
Also, try editing some console.log arguments or just console.log any object you like.
The code coverage and inline messages are automatically be updated, just as you type.
Here is what coverage indicators mean:
- Gray square means that the source line is not covered by any of your tests.
- Green square means that the source line is covered by at least one of your tests.
- Yellow square means that the source line is only partially covered by some of your tests.
- Red square means that the source line is the source of an error or failed expectation, or is in the stack of an error.
- Pink square means that the source line is on the execution path of a failing test.
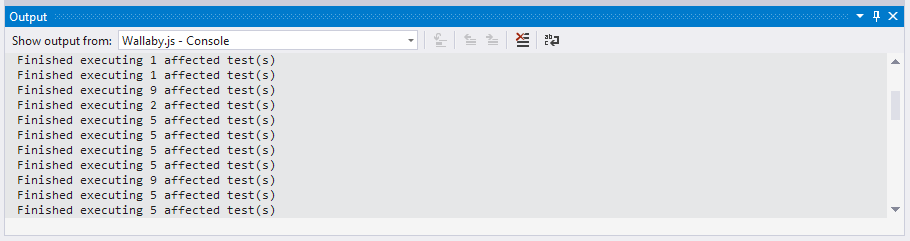
You may also inspect wallaby.js output in the Output tool window. In the tool window you may view output from Failing Tests tab and Console.
Failing Tests output source displays all tests that are currently failing along with the error stacks and registered console.log calls. Some bits of the displayed information are hyperlinks that you can use with your mouse (Ctrl + mouse click) or keyboard (F12) to navigate to different places, for example to the exact error line, or a failing test, or a place where something is logged to console.
Console output source displays some additional information about test execution progress. The tab can also be useful for troubleshooting wallaby.js issues.
Smart actions
To help you writing your code and tests more efficiently, wallaby.js provides a few smart actions available by clicking wallaby smart actions icon or pressing Ctrl + . on any line.
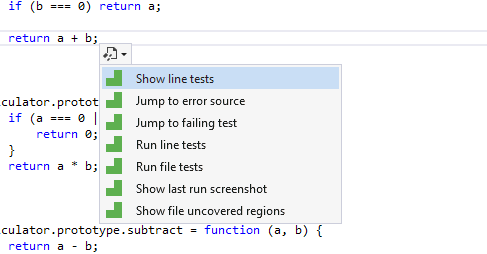
The actions include:
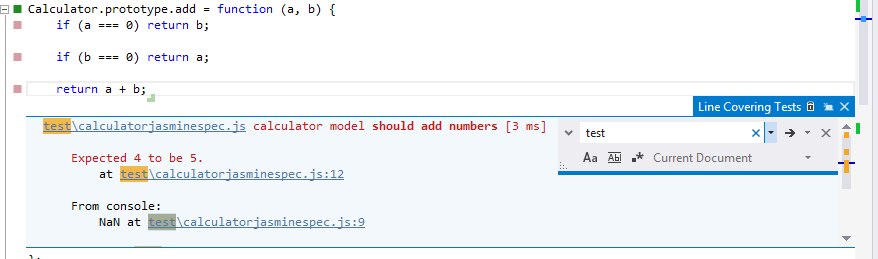
- Show line test(s) action: displays the line related test data. This is the most frequently used action that allows you to quickly view and navigate to test and code errors, console messages related to some specific test or some source code line.
- Jump to failing test action: allows to quickly navigate to the failing test from any “pink” context (the failing test execution path).
- Jump to error source action: allows to quickly navigate to the source of the test error from any “pink” context (failing test execution path).
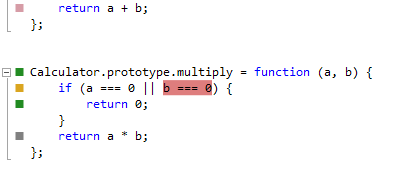
- Show line uncovered regions: the action is useful for “yellow” lines to display what is exactly not covered in the line. Not covered expressions will be highlighted in red.
- Show file uncovered regions: the action is similar to the previous one, it displays uncovered regions for the whole file. The red highlights for both actions can be removed by pressing
Esc(or you can just start changing the file code and they will disappear).
- Run line test(s): the action is pretty simple (yet so much wanted by so many people), it just runs a single test (if invoked from within the test) or all related tests (if invoked within some source code covered by the tests).
- Run file test(s): the action runs all tests within the test file it is invoked in, or all tests in all the test files that cover the source file that the action is invoked within.
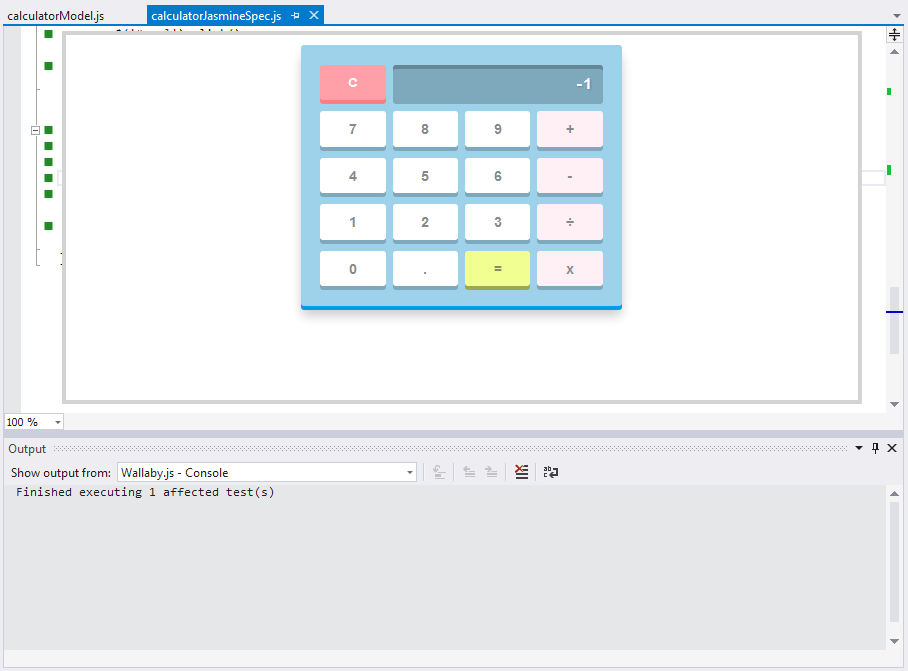
- Show last run screen shot: the action just does what it says. After every test run, wallaby.js captures a screen shot of the generated test runner page, so if you have some tests that are displaying anything - the action could be useful for you. Very powerful combo is using the action together with the
Run line test(s)- you run a specific test, then view the screen shot for the test. Please note that you may often have some “tear down” code, that clears the DOM before or after each test - wallaby.js is smart enough to capture the screenshot before the tear down code.
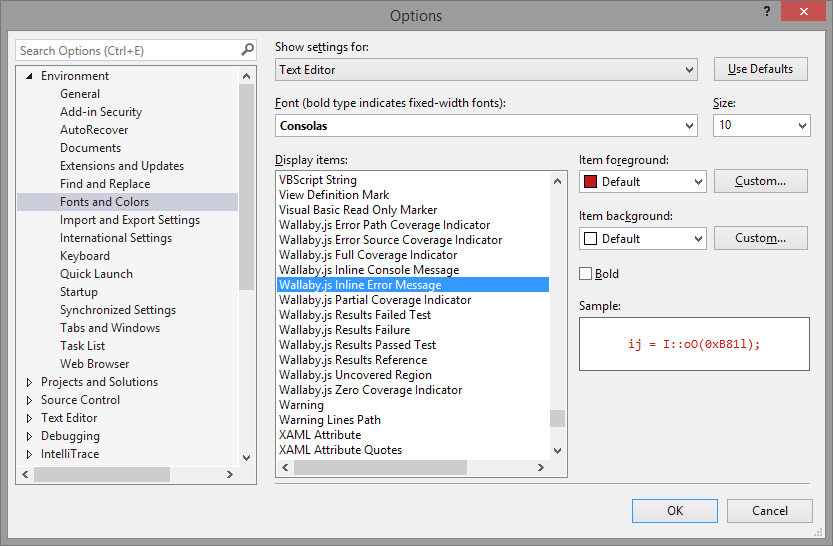
Fonts and colors
If some of wallaby.js default colors don’t fit your theme, it’s very easy to adjust.
More information
- Follow us on twitter and subscribe to our newsletter to stay updated.
- Browse our documentation, ask questions or create issues.
- Check out wallaby.js pricing for Visual Studio.
- Consider getting yourself a copy of “Freedom” license today to help the project and be able to use wallaby.js in any editor that we support today and will support in future.