Wallaby.js for Atom text editor
Wallaby.js is a continuous test runner for JavaScript. It solves the fundamental issue of being able to provide an instant feedback from your tests as you write your code, no matter how large your codebase is. Wallaby.js uses smart dependency analysis to only execute tests affected by your code changes and leverages parallel test execution.
It also displays test execution results, including code coverage, right in your code editor. No context switching, no need to switch to browser - it’s game changing. The tool pays for itself very quickly and is bringing you to a whole new productivity level.
When wallaby.js was released early this year, it was supporting only IntelliJ platform IDEs, such as WebStorm and IntelliJ IDEA, a few months ago we have added Visual Studio support. Now it’s time to bring the awesomeness of wallaby to Atom text editor. The lightweight and elegant editor plus the power of wallaby.js is a great combo to deal with JavaScript projects of any size fast and easy.
Setting up
Wallaby.js for Atom consists of three separately versioned parts: Atom Package, wallaby.js Plugin and wallaby.js Core.
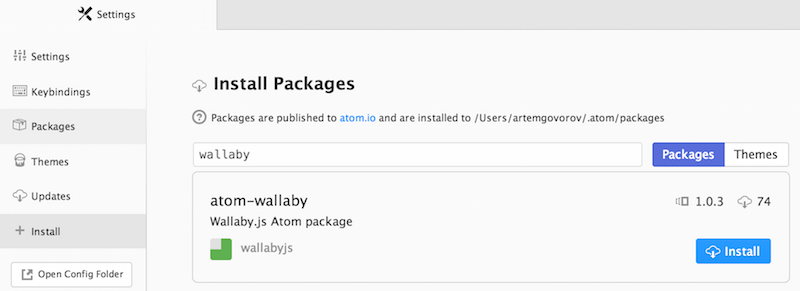
To get started, you need to install wallaby.js Atom package from your editor (Settings - Install).
After the package is installed, wallaby.js Plugin and wallaby.js Core will be automatically downloaded and installed. The Atom package is just a loader/updater of wallaby.js Plugin and Core, it gets updated quite infrequently and does it the same way as all other Atom packages that you may have installed.
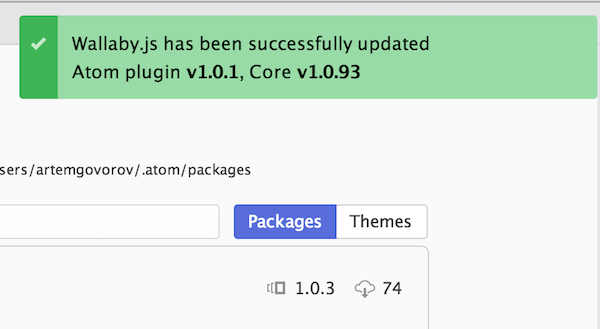
Wallaby.js Plugin and wallaby.js Core on the other hand are updated more frequently, the update is performed automatically behind the scenes and the notification is displayed when the update is finished.
Sample code
For this tutorial I will use this sample calculator repository. You can clone it to try locally:
git clone https://github.com/wallabyjs/calculator-sample.git
Once you have the source code locally, open the project folder in Atom.
There you will find a simple calculator project there with wallaby.js configuration file. Wallaby configuration file is a simple JSON or JavaScript file in your project root folder with just a couple of mandatory settings. The configuration file includes a list of files and tests of your application as well as some settings for various technologies that you may be using to build your project, such as Webpack or Browserify configuration Babel/CoffeeScript/TypeScript compiler options, etc.
Wallaby supports lots of technologies and scenarios, we have collection of sample projects with configuration files for different tools, frameworks and languages, such as Webpack, Browserify, ES6 and ES7 via Babel, TypeScript and CoffeeScript, React and Angular, node.js and io.js, etc.

First steps
Selecting wallaby.js config file
Wallaby.js for Atom needs to know what configuration file to use to run your tests. If you only have one file named wallaby.js/wallaby.conf.js or wallaby.json in your project root, wallaby will automatically select it.
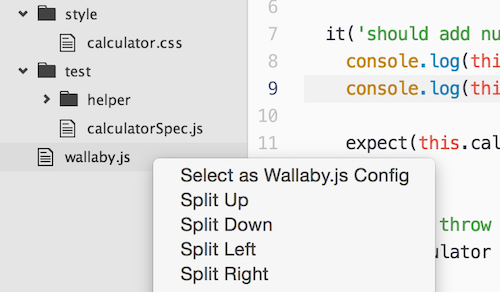
However, if you have multiple configuration files, use different naming convention or have the config file not in the root folder, you may select the config file from the Tree View with context menu or by opening the config in an editor tab and using Select as Wallaby.js Config context menu item.
Wallaby.js Command Palette
As you probably know, you may press Ctrl/Cmd + Shift + P in Atom to get the editor Command Palette in case if you’ve forgotten some shortcuts or just like invoking commands this way. There you may search for wallaby and use the found commands.
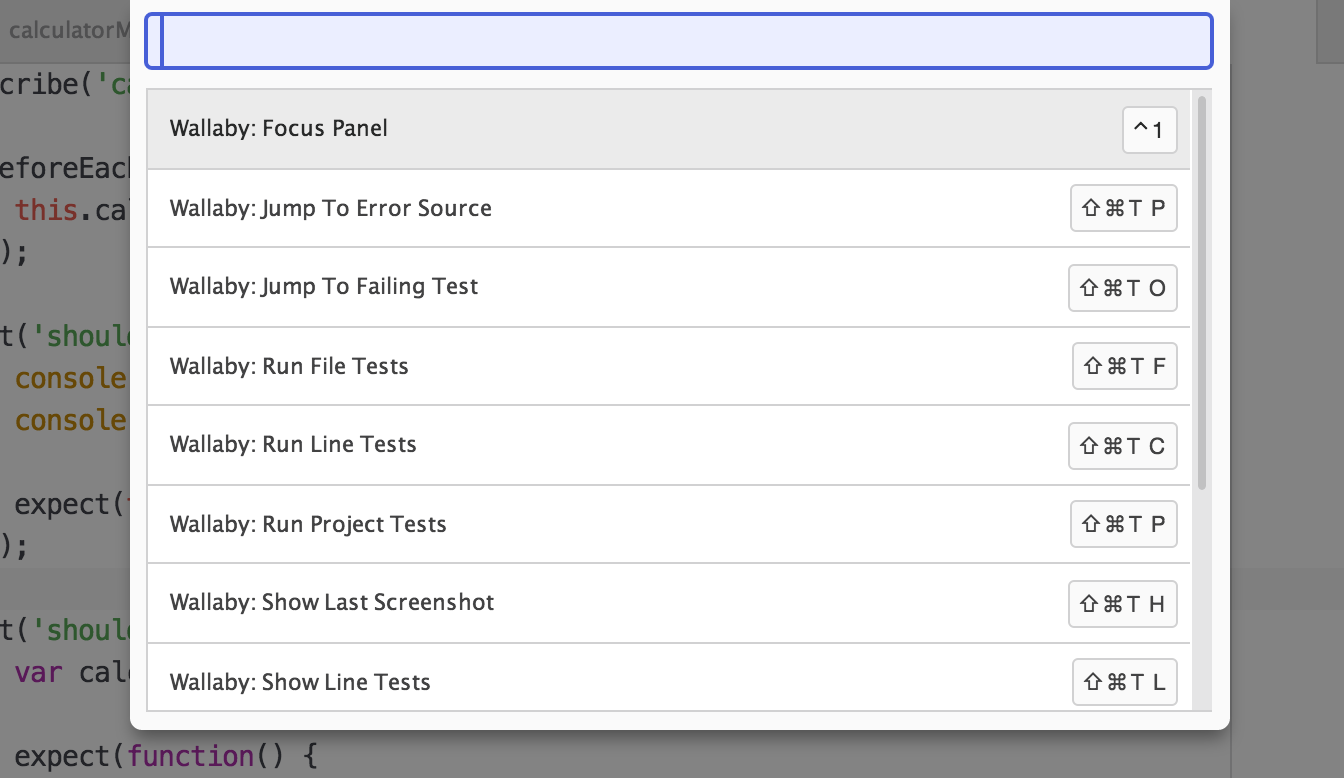
Also, for your convenience wallaby.js adds its own Command Palette to Atom that you may display by pressing Ctrl/Cmd + Shift + Space. It’s a fast and easy way to quickly use various wallaby features.
Wallaby.js Panel
One of the things you’ll be using a lot is wallaby.js Panel. It displays the name of the selected config file, failing test results as well as some test stats. You can open and collapse it by using the corresponding command (from the palette or via Ctrl/Cmd + Shift + T, T shortcut).
Let’s try starting wallaby.js: to do that you need to invoke wallaby Start command. You may do it by using the Ctrl/Cmd + Shift + T, R shortcut, or using wallaby Command Palette, or by clicking Start button on the wallaby.js Panel.
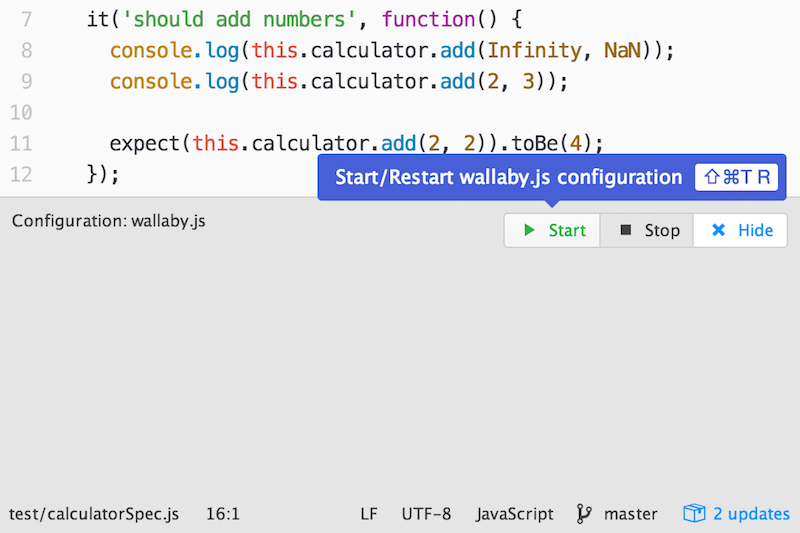
To stop wallaby.js, you may use Stop command or Stop button on the wallaby.js Panel.
Now let’s have some fun.
Wallaby.js in action

Once you have started wallaby.js, at the bottom right corner of the editor you’ll see wallaby status indicator. It’s job is pretty simple: when it displays a spinner - your tests are running, when it’s red - you have some failing tests, when it’s green - all of your tests are passing. You may also use the indicator to toggle wallaby.js Panel by clicking it.
Now, let’s open the sample calculator project spec (test/calculatorSpec.js).
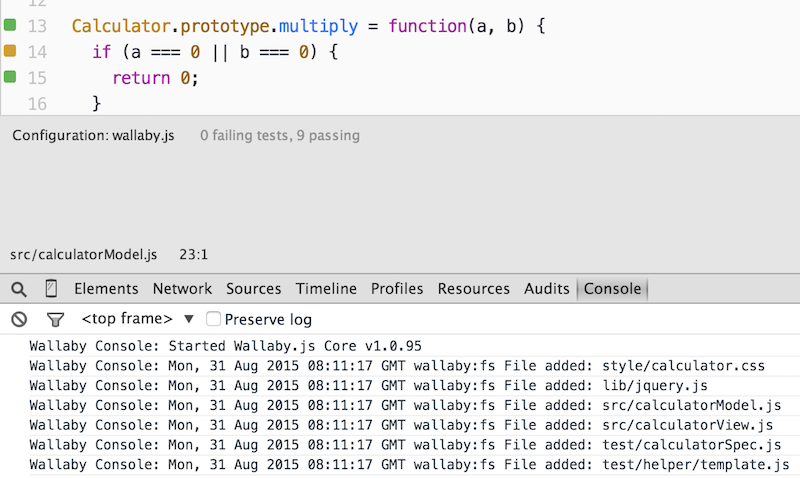
When wallaby.js is running, you can see the code coverage in opened source files (specified in wallaby configuration file). As you can see, there are various colored squares displayed for each line of your source code.
Try jumping to any of the passing tests and break it, for example try changing the 2 plus 2 expectation result to 5 in the should add numbers test, or try breaking the code covered by the test. Right after the change wallaby.js automatically runs your tests and displays the result in Atom, right where you need to see it.
The code coverage and inline messages are automatically updated, just as you type.
Also, try editing some console.log arguments or just console.log any object you like.
This is a great way to quickly inspect any objects without having to leave your editor, without switching to any other console. Think how cool it is - your code editor is your console with all the required context.
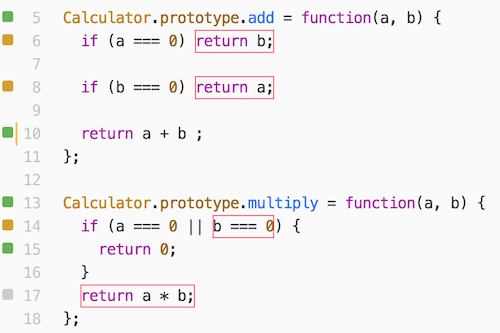
Coverage indicators
Let’s have a look at the editor gutter where you may see some indicators. Here is what these coverage indicators mean:
- Gray square means that the source line is not covered by any of your tests.
- Green square means that the source line is covered by at least one of your tests.
- Yellow square means that the source line is only partially covered by some of your tests.
- Red square means that the source line is the source of an error or failed expectation, or is in the stack of an error.
- Pink square means that the source line is on the execution path of a failing test.
Any indicator click triggers Show line tests command which we will review later.
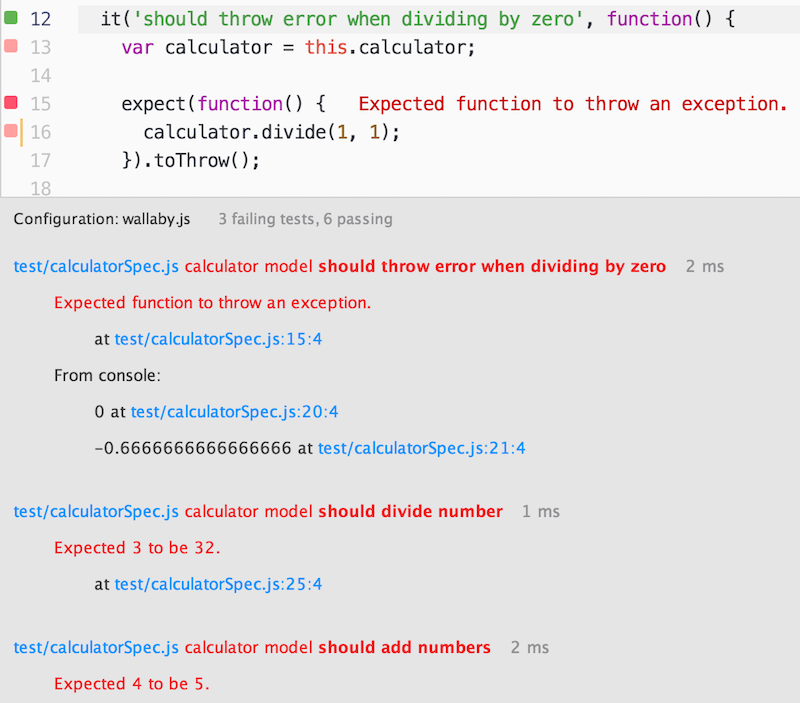
Failing tests
Wallaby.js Panel displays all tests that are currently failing along with the error stacks and registered console.log calls. Some bits of the displayed information are hyperlinks that you can use with your mouse or keyboard (Enter) to navigate to different places, for example to the exact error line, or a failing test, or a place where something is logged to console. To quickly focus the panel you may use the Focus Panel wallaby command (Ctrl + 1), pressing Esc will return the focus back to the editor.
Commands
To help you writing/navigating your code and tests more efficiently, wallaby.js provides a few commands. You may see the full list in the wallaby.js Command Palette (Ctrl/Cmd + Shift + Space).
These commands include:
- Show line tests: displays the line related test data. The command allows you to quickly view all tests (both failing and passing) that cover the current line of code, navigate to test and code errors, view console messages related to some specific test or some source code line.
- Jump to failing test: allows to quickly navigate to the failing test from any ‘pink’ context (the failing test execution path).
- Jump to error source: allows to quickly navigate to the source of the test error from any ‘pink’ context (failing test execution path).
- Toggle uncovered regions: displays/hides uncovered regions for an opened file. The command is very useful for ‘yellow’ lines to display what is exactly not covered in the line. Highlighted markers will automatically disappear when you start editing your code.
- Run line tests: the command is pretty simple, it just runs a single test (if invoked from within the test) or all related tests (if invoked within some source code covered by the tests).
- Run file tests: the command runs all tests within the test file it is invoked in, or all tests in all the test files that cover the source file that the command is invoked within.
- Run project tests: the command runs all project tests.
- Show last run screen shot: the command just does what it says. After every test run, wallaby.js captures a screen shot of the generated test runner page, so if you have some tests that are displaying anything - the command could be useful for you. Very powerful combo is using the command together with the
Run line tests- you run a specific test, then view the screen shot for the test. Please note that you may often have some ‘tear down’ code, that clears the DOM before or after each test - wallaby.js is smart enough to capture the screenshot before the tear down code. Atom automatically updates the screen shot file when it’s changed, that allows you to have ‘live’ preview right in your editor.
Troubleshooting
If you encounter any issues with configuring or using wallaby.js and not sure why it happens, check out our troubleshooting docs section or search our public repository issues to see if someone else have been experiencing something similar.
Another useful technique is to run wallaby.js with the debug flag set to true. In this case wallaby outputs a lot of additional information about the test execution progress which may help you to understand what’s going on if something goes wrong. The output can be viewed in the Developer Tools Console (Ctrl/Cmd + Alt + I).
More information
- Follow us on twitter and subscribe to our newsletter to stay updated.
- Browse our full documentation, ask questions or create issues.
- Check out wallaby.js planned pricing for Atom to get an idea how much it’ll cost after the beta period ends.
- Consider getting yourself a copy of ‘Freedom’ license today to help the project and be able to use wallaby.js in any editor that we support today and will support in future.